for i in {1..20};do curl -s -k https://api.ip.sb/ip -H 'user-agent: zsh-proxy' -x "http://127.0.0.1:8443" ;done
运行效果
在做 base64 支持的同时,发现 glider 对代理的新特性不支持:
不支持 trogan 的 alpn 和 udp
不支持 vmess 的 udp 以及 network: grpc
如果发现有的节点因为找不到 dns 记录连接失败
需要这样配置dns服务器
1 2 3 4 5
# Setup a dns forwarding server dns=:53 # global remote dns server (you can specify different dns server in rule file) dnsserver=1.1.1.1 dnsserver=8.8.8.8
// Do is the SPNEGO enabled HTTP client's equivalent of the http.Client's Do method. func(c *Client)Do(req *http.Request)(resp *http.Response, err error) { var body bytes.Buffer if req.Body != nil { // Use a tee reader to capture any body sent in case we have to replay it again teeR := io.TeeReader(req.Body, &body) teeRC := teeReadCloser{teeR, req.Body} req.Body = teeRC } resp, err = c.Client.Do(req) if err != nil { if ue, ok := err.(*url.Error); ok { if e, ok := ue.Err.(redirectErr); ok { // Picked up a redirect e.reqTarget.Header.Del(HTTPHeaderAuthRequest) c.reqs = append(c.reqs, e.reqTarget) iflen(c.reqs) >= 10 { return resp, errors.New("stopped after 10 redirects") } if req.Body != nil { // Refresh the body reader so the body can be sent again e.reqTarget.Body = ioutil.NopCloser(&body) } return c.Do(e.reqTarget) } } return resp, err } if respUnauthorizedNegotiate(resp) { err := SetSPNEGOHeader(c.krb5Client, req, c.spn) if err != nil { return resp, err } if req.Body != nil { // Refresh the body reader so the body can be sent again req.Body = ioutil.NopCloser(&body) } return c.Do(req) } return resp, err }
from AppKit import NSWorkspace import time t = range(1,100) for i in t: time.sleep(3) activeAppName = NSWorkspace.sharedWorkspace().activeApplication()['NSApplicationName'] print(activeAppName)
但是运行报错,提示 ModuleNotFoundError: No module named 'AppKit'
Valid starting Expires Service principal 03/17/23 17:29:32 03/16/24 17:29:32 krbtgt/OSS5.COM@OSS5.COM renew until 03/14/33 17:29:32
执行 hdfs dfs -ls / 报错
1 2 3 4 5 6 7
23/03/17 17:29:32 WARN util.NativeCodeLoader: Unable to load native-hadoop library for your platform... using builtin-java classes where applicable 23/03/17 17:29:34 WARN shortcircuit.DomainSocketFactory: The short-circuit local reads feature cannot be used because libhadoop cannot be loaded. 23/03/17 17:29:34 WARN ipc.Client: Exception encountered while connecting to the server : org.apache.hadoop.security.AccessControlException: Client cannot authenticate via:[TOKEN, KERBEROS] 23/03/17 17:29:34 WARN ipc.Client: Exception encountered while connecting to the server : org.apache.hadoop.security.AccessControlException: Client cannot authenticate via:[TOKEN, KERBEROS] 23/03/17 17:29:34 INFO retry.RetryInvocationHandler: java.io.IOException: DestHost:destPort <REDACTED NAMENODE>:8020 , LocalHost:localPort <REDACTED LOCAL HOSTNAME>/<REDACTED LOCAL IP>:0. Failed on local exception: java.io.IOException: org.apache.hadoop.security.AccessControlException: Client cannot authenticate via:[TOKEN, KERBEROS], while invoking ClientNamenodeProtocolTranslatorPB.getFileInfo over <REDACTED NAMENODE>/<REDACTED NAMENODE IP>:8020 after 1 failover attempts. Trying to failover after sleeping for 1160ms. 23/03/17 17:29:35 WARN ipc.Client: Exception encountered while connecting to the server : org.apache.hadoop.security.AccessControlException: Client cannot authenticate via:[TOKEN, KERBEROS] 23/03/17 17:29:35 INFO retry.RetryInvocationHandler: java.io.IOException: DestHost:destPort <REDACTED NAMENODE>:8020 , LocalHost:localPort <REDACTED LOCAL HOSTNAME>/<REDACTED LOCAL IP>:0. Failed on local exception: java.io.IOException: org.apache.hadoop.security.AccessControlException: Client cannot authenticate via:[TOKEN, KERBEROS], while invoking ClientNamenodeProtocolTranslatorPB.getFileInfo over <REDACTED NAMENODE>/<REDACTED NAMENODE IP>:8020 after 2 failover attempts. Trying to failover after sleeping for 2093ms.
var ( dns_request_total = promauto.NewCounter( prometheus.CounterOpts{ Name: "dns_request_total", Help: "The total number of processed dns requests", }, ) )
;; ANSWER SECTION: 171.150.10.106.in-addr.arpa. 300 IN PTR unknown.yahoo.com.
;; AUTHORITY SECTION: in-addr.arpa. 285 IN NS b.in-addr-servers.arpa. in-addr.arpa. 285 IN NS f.in-addr-servers.arpa. in-addr.arpa. 285 IN NS a.in-addr-servers.arpa. in-addr.arpa. 285 IN NS c.in-addr-servers.arpa. in-addr.arpa. 285 IN NS d.in-addr-servers.arpa. in-addr.arpa. 285 IN NS e.in-addr-servers.arpa.
;; ADDITIONAL SECTION: a.in-addr-servers.arpa. 285 IN A 199.180.182.53 b.in-addr-servers.arpa. 285 IN A 199.253.183.183 c.in-addr-servers.arpa. 285 IN A 196.216.169.10 d.in-addr-servers.arpa. 285 IN A 200.10.60.53 e.in-addr-servers.arpa. 285 IN A 203.119.86.101 f.in-addr-servers.arpa. 285 IN A 193.0.9.1
/user/joe/wordcount/input - input directory in HDFS /user/joe/wordcount/output - output directory in HDFS
准备输入文件
1 2 3 4 5
vi file01 Hello World Bye World
vi file02 Hello Hadoop Goodbye Hadoop
hdfs dfs -put file* /user/joe/wordcount/input
执行 wordcount
1
$ hadoop jar wc.jar WordCount /user/joe/wordcount/input /user/joe/wordcount/output
然后果然报错了
1
Error: Java.io.IOException: initialization of all the collectors failed. Error in last collector was:java.io.IOException: Invalid “mapreduce.task.io.sort.mb”:3276.
一些关键字使用[REDACTED]代替
详细报错,点击展开
[[REDACTED]@[REDACTED] ~]$ hadoop jar wc.jar WordCount /user/[REDACTED]/input /user/[REDACTED]/output 22/12/20 21:11:32 INFO client.AHSProxy: Connecting to Application History server at [REDACTED].com/[REDACTED]:10200 22/12/20 21:11:32 INFO hdfs.DFSClient: Created token for [REDACTED]: HDFS_DELEGATION_TOKEN owner=[REDACTED]@[REDACTED], renewer=yarn, realUser=, issueDate=1671541893766, maxDate=1672146693766, sequenceNumber=75, masterKeyId=37 on ha-hdfs:osea 22/12/20 21:11:32 INFO security.TokenCache: Got dt for hdfs://osea; Kind: HDFS_DELEGATION_TOKEN, Service: ha-hdfs:osea, Ident: (token for [REDACTED]: HDFS_DELEGATION_TOKEN owner=[REDACTED]@[REDACTED], renewer=yarn, realUser=, issueDate=1671541893766, maxDate=1672146693766, sequenceNumber=75, masterKeyId=37) 22/12/20 21:11:32 WARN mapreduce.JobResourceUploader: Hadoop command-line option parsing not performed. Implement the Tool interface and execute your application with ToolRunner to remedy this. 22/12/20 21:11:32 INFO mapreduce.JobResourceUploader: Disabling Erasure Coding for path: /user/[REDACTED]/.staging/job_1670950620170_0046 22/12/20 21:11:33 INFO input.FileInputFormat: Total input files to process : 2 22/12/20 21:11:33 INFO mapreduce.JobSubmitter: number of splits:2 22/12/20 21:11:33 INFO mapreduce.JobSubmitter: Submitting tokens for job: job_1670950620170_0046 22/12/20 21:11:33 INFO mapreduce.JobSubmitter: Executing with tokens: [Kind: HDFS_DELEGATION_TOKEN, Service: ha-hdfs:osea, Ident: (token for [REDACTED]: HDFS_DELEGATION_TOKEN owner=[REDACTED]@[REDACTED], renewer=yarn, realUser=, issueDate=1671541893766, maxDate=1672146693766, sequenceNumber=75, masterKeyId=37)] 22/12/20 21:11:33 INFO conf.Configuration: found resource resource-types.xml at file:/etc/hadoop/3.1.5.0-152/0/resource-types.xml 22/12/20 21:11:33 INFO impl.TimelineClientImpl: Timeline service address: ose688.[REDACTED]:8188 22/12/20 21:11:34 INFO impl.YarnClientImpl: Submitted application application_1670950620170_0046 22/12/20 21:11:34 INFO mapreduce.Job: The url to track the job: http://ose688.[REDACTED]:8088/proxy/application_1670950620170_0046/ 22/12/20 21:11:34 INFO mapreduce.Job: Running job: job_1670950620170_0046 22/12/20 21:11:42 INFO mapreduce.Job: Job job_1670950620170_0046 running in uber mode : false 22/12/20 21:11:42 INFO mapreduce.Job: map 0% reduce 0% 22/12/20 21:11:47 INFO mapreduce.Job: Task Id : attempt_1670950620170_0046_m_000000_0, Status : FAILED Error: java.io.IOException: Initialization of all the collectors failed. Error in last collector was:java.io.IOException: Invalid “mapreduce.task.io.sort.mb”: 3276 at org.apache.hadoop.mapred.MapTask.createSortingCollector(MapTask.java:423) at org.apache.hadoop.mapred.MapTask.access$100(MapTask.java:82) at org.apache.hadoop.mapred.MapTask$NewOutputCollector.(MapTask.java:710) at org.apache.hadoop.mapred.MapTask.runNewMapper(MapTask.java:782) at org.apache.hadoop.mapred.MapTask.run(MapTask.java:347) at org.apache.hadoop.mapred.YarnChild$2.run(YarnChild.java:174) at java.security.AccessController.doPrivileged(Native Method) at javax.security.auth.Subject.doAs(Subject.java:422) at org.apache.hadoop.security.UserGroupInformation.doAs(UserGroupInformation.java:1730) at org.apache.hadoop.mapred.YarnChild.main(YarnChild.java:168) Caused by: java.io.IOException: Invalid “mapreduce.task.io.sort.mb”: 3276 at org.apache.hadoop.mapred.MapTask$MapOutputBuffer.init(MapTask.java:991) at org.apache.hadoop.mapred.MapTask.createSortingCollector(MapTask.java:408) … 9 more
22/12/20 21:11:50 INFO mapreduce.Job: Task Id : attempt_1670950620170_0046_m_000001_0, Status : FAILED Error: java.io.IOException: Initialization of all the collectors failed. Error in last collector was:java.io.IOException: Invalid “mapreduce.task.io.sort.mb”: 3276 at org.apache.hadoop.mapred.MapTask.createSortingCollector(MapTask.java:423) at org.apache.hadoop.mapred.MapTask.access$100(MapTask.java:82) at org.apache.hadoop.mapred.MapTask$NewOutputCollector.(MapTask.java:710) at org.apache.hadoop.mapred.MapTask.runNewMapper(MapTask.java:782) at org.apache.hadoop.mapred.MapTask.run(MapTask.java:347) at org.apache.hadoop.mapred.YarnChild$2.run(YarnChild.java:174) at java.security.AccessController.doPrivileged(Native Method) at javax.security.auth.Subject.doAs(Subject.java:422) at org.apache.hadoop.security.UserGroupInformation.doAs(UserGroupInformation.java:1730) at org.apache.hadoop.mapred.YarnChild.main(YarnChild.java:168) Caused by: java.io.IOException: Invalid “mapreduce.task.io.sort.mb”: 3276 at org.apache.hadoop.mapred.MapTask$MapOutputBuffer.init(MapTask.java:991) at org.apache.hadoop.mapred.MapTask.createSortingCollector(MapTask.java:408) … 9 more
22/12/20 21:11:54 INFO mapreduce.Job: Task Id : attempt_1670950620170_0046_m_000000_1, Status : FAILED Error: java.io.IOException: Initialization of all the collectors failed. Error in last collector was:java.io.IOException: Invalid “mapreduce.task.io.sort.mb”: 3276 at org.apache.hadoop.mapred.MapTask.createSortingCollector(MapTask.java:423) at org.apache.hadoop.mapred.MapTask.access$100(MapTask.java:82) at org.apache.hadoop.mapred.MapTask$NewOutputCollector.(MapTask.java:710) at org.apache.hadoop.mapred.MapTask.runNewMapper(MapTask.java:782) at org.apache.hadoop.mapred.MapTask.run(MapTask.java:347) at org.apache.hadoop.mapred.YarnChild$2.run(YarnChild.java:174) at java.security.AccessController.doPrivileged(Native Method) at javax.security.auth.Subject.doAs(Subject.java:422) at org.apache.hadoop.security.UserGroupInformation.doAs(UserGroupInformation.java:1730) at org.apache.hadoop.mapred.YarnChild.main(YarnChild.java:168) Caused by: java.io.IOException: Invalid “mapreduce.task.io.sort.mb”: 3276 at org.apache.hadoop.mapred.MapTask$MapOutputBuffer.init(MapTask.java:991) at org.apache.hadoop.mapred.MapTask.createSortingCollector(MapTask.java:408) … 9 more
22/12/20 21:11:57 INFO mapreduce.Job: Task Id : attempt_1670950620170_0046_m_000001_1, Status : FAILED Error: java.io.IOException: Initialization of all the collectors failed. Error in last collector was:java.io.IOException: Invalid “mapreduce.task.io.sort.mb”: 3276 at org.apache.hadoop.mapred.MapTask.createSortingCollector(MapTask.java:423) at org.apache.hadoop.mapred.MapTask.access$100(MapTask.java:82) at org.apache.hadoop.mapred.MapTask$NewOutputCollector.(MapTask.java:710) at org.apache.hadoop.mapred.MapTask.runNewMapper(MapTask.java:782) at org.apache.hadoop.mapred.MapTask.run(MapTask.java:347) at org.apache.hadoop.mapred.YarnChild$2.run(YarnChild.java:174) at java.security.AccessController.doPrivileged(Native Method) at javax.security.auth.Subject.doAs(Subject.java:422) at org.apache.hadoop.security.UserGroupInformation.doAs(UserGroupInformation.java:1730) at org.apache.hadoop.mapred.YarnChild.main(YarnChild.java:168) Caused by: java.io.IOException: Invalid “mapreduce.task.io.sort.mb”: 3276 at org.apache.hadoop.mapred.MapTask$MapOutputBuffer.init(MapTask.java:991) at org.apache.hadoop.mapred.MapTask.createSortingCollector(MapTask.java:408) … 9 more
22/12/20 21:12:02 INFO mapreduce.Job: Task Id : attempt_1670950620170_0046_m_000000_2, Status : FAILED Error: java.io.IOException: Initialization of all the collectors failed. Error in last collector was:java.io.IOException: Invalid “mapreduce.task.io.sort.mb”: 3276 at org.apache.hadoop.mapred.MapTask.createSortingCollector(MapTask.java:423) at org.apache.hadoop.mapred.MapTask.access$100(MapTask.java:82) at org.apache.hadoop.mapred.MapTask$NewOutputCollector.(MapTask.java:710) at org.apache.hadoop.mapred.MapTask.runNewMapper(MapTask.java:782) at org.apache.hadoop.mapred.MapTask.run(MapTask.java:347) at org.apache.hadoop.mapred.YarnChild$2.run(YarnChild.java:174) at java.security.AccessController.doPrivileged(Native Method) at javax.security.auth.Subject.doAs(Subject.java:422) at org.apache.hadoop.security.UserGroupInformation.doAs(UserGroupInformation.java:1730) at org.apache.hadoop.mapred.YarnChild.main(YarnChild.java:168) Caused by: java.io.IOException: Invalid “mapreduce.task.io.sort.mb”: 3276 at org.apache.hadoop.mapred.MapTask$MapOutputBuffer.init(MapTask.java:991) at org.apache.hadoop.mapred.MapTask.createSortingCollector(MapTask.java:408) … 9 more
22/12/20 21:12:04 INFO mapreduce.Job: Task Id : attempt_1670950620170_0046_m_000001_2, Status : FAILED Error: java.io.IOException: Initialization of all the collectors failed. Error in last collector was:java.io.IOException: Invalid “mapreduce.task.io.sort.mb”: 3276 at org.apache.hadoop.mapred.MapTask.createSortingCollector(MapTask.java:423) at org.apache.hadoop.mapred.MapTask.access$100(MapTask.java:82) at org.apache.hadoop.mapred.MapTask$NewOutputCollector.(MapTask.java:710) at org.apache.hadoop.mapred.MapTask.runNewMapper(MapTask.java:782) at org.apache.hadoop.mapred.MapTask.run(MapTask.java:347) at org.apache.hadoop.mapred.YarnChild$2.run(YarnChild.java:174) at java.security.AccessController.doPrivileged(Native Method) at javax.security.auth.Subject.doAs(Subject.java:422) at org.apache.hadoop.security.UserGroupInformation.doAs(UserGroupInformation.java:1730) at org.apache.hadoop.mapred.YarnChild.main(YarnChild.java:168) Caused by: java.io.IOException: Invalid “mapreduce.task.io.sort.mb”: 3276 at org.apache.hadoop.mapred.MapTask$MapOutputBuffer.init(MapTask.java:991) at org.apache.hadoop.mapred.MapTask.createSortingCollector(MapTask.java:408) … 9 more
$ hadoop jar wc.jar WordCount /user/joe/wordcount/input /user/joe/wordcount/output
任务执行成功的详细日志
[[REDACTED]@[REDACTED] ~]$ hdfs dfs -rm -r /user/[REDACTED]/output 22/12/20 21:15:25 INFO fs.TrashPolicyDefault: Moved: ‘hdfs://osea/user/[REDACTED]/output’ to trash at: hdfs://osea/user/[REDACTED]/.Trash/Current/user/[REDACTED]/output1671542125954
[[REDACTED]@[REDACTED] ~]$ hadoop jar wc.jar WordCount /user/[REDACTED]/input /user/[REDACTED]/output 22/12/20 21:15:32 INFO client.AHSProxy: Connecting to Application History server at ose688.[REDACTED]/[REDACTED]:10200 22/12/20 21:15:32 INFO hdfs.DFSClient: Created token for [REDACTED]: HDFS_DELEGATION_TOKEN owner=[REDACTED]@[REDACTED], renewer=yarn, realUser=, issueDate=1671542133482, maxDate=1672146933482, sequenceNumber=76, masterKeyId=37 on ha-hdfs:osea 22/12/20 21:15:32 INFO security.TokenCache: Got dt for hdfs://osea; Kind: HDFS_DELEGATION_TOKEN, Service: ha-hdfs:osea, Ident: (token for [REDACTED]: HDFS_DELEGATION_TOKEN owner=[REDACTED]@[REDACTED], renewer=yarn, realUser=, issueDate=1671542133482, maxDate=1672146933482, sequenceNumber=76, masterKeyId=37) 22/12/20 21:15:32 WARN mapreduce.JobResourceUploader: Hadoop command-line option parsing not performed. Implement the Tool interface and execute your application with ToolRunner to remedy this. 22/12/20 21:15:32 INFO mapreduce.JobResourceUploader: Disabling Erasure Coding for path: /user/[REDACTED]/.staging/job_1670950620170_0047 22/12/20 21:15:32 INFO input.FileInputFormat: Total input files to process : 2 22/12/20 21:15:32 INFO mapreduce.JobSubmitter: number of splits:2 22/12/20 21:15:33 INFO mapreduce.JobSubmitter: Submitting tokens for job: job_1670950620170_0047 22/12/20 21:15:33 INFO mapreduce.JobSubmitter: Executing with tokens: [Kind: HDFS_DELEGATION_TOKEN, Service: ha-hdfs:osea, Ident: (token for [REDACTED]: HDFS_DELEGATION_TOKEN owner=[REDACTED]@[REDACTED], renewer=yarn, realUser=, issueDate=1671542133482, maxDate=1672146933482, sequenceNumber=76, masterKeyId=37)] 22/12/20 21:15:33 INFO conf.Configuration: found resource resource-types.xml at file:/etc/hadoop/3.1.5.0-152/0/resource-types.xml 22/12/20 21:15:33 INFO impl.TimelineClientImpl: Timeline service address: ose688.[REDACTED]:8188 22/12/20 21:15:34 INFO impl.YarnClientImpl: Submitted application application_1670950620170_0047 22/12/20 21:15:34 INFO mapreduce.Job: The url to track the job: http://ose688.[REDACTED]:8088/proxy/application_1670950620170_0047/ 22/12/20 21:15:34 INFO mapreduce.Job: Running job: job_1670950620170_0047 22/12/20 21:15:43 INFO mapreduce.Job: Job job_1670950620170_0047 running in uber mode : false 22/12/20 21:15:43 INFO mapreduce.Job: map 0% reduce 0% 22/12/20 21:15:52 INFO mapreduce.Job: map 100% reduce 0% 22/12/20 21:15:59 INFO mapreduce.Job: map 100% reduce 100% 22/12/20 21:16:00 INFO mapreduce.Job: Job job_1670950620170_0047 completed successfully 22/12/20 21:16:00 INFO mapreduce.Job: Counters: 53 File System Counters FILE: Number of bytes read=79 FILE: Number of bytes written=747874 FILE: Number of read operations=0 FILE: Number of large read operations=0 FILE: Number of write operations=0 HDFS: Number of bytes read=260 HDFS: Number of bytes written=41 HDFS: Number of read operations=11 HDFS: Number of large read operations=0 HDFS: Number of write operations=2 Job Counters Launched map tasks=2 Launched reduce tasks=1 Rack-local map tasks=2 Total time spent by all maps in occupied slots (ms)=103928 Total time spent by all reduces in occupied slots (ms)=43184 Total time spent by all map tasks (ms)=12991 Total time spent by all reduce tasks (ms)=5398 Total vcore-milliseconds taken by all map tasks=12991 Total vcore-milliseconds taken by all reduce tasks=5398 Total megabyte-milliseconds taken by all map tasks=106422272 Total megabyte-milliseconds taken by all reduce tasks=44220416 Map-Reduce Framework Map input records=2 Map output records=8 Map output bytes=82 Map output materialized bytes=85 Input split bytes=210 Combine input records=8 Combine output records=6 Reduce input groups=5 Reduce shuffle bytes=85 Reduce input records=6 Reduce output records=5 Spilled Records=12 Shuffled Maps =2 Failed Shuffles=0 Merged Map outputs=2 GC time elapsed (ms)=312 CPU time spent (ms)=5030 Physical memory (bytes) snapshot=5385678848 Virtual memory (bytes) snapshot=27895767040 Total committed heap usage (bytes)=6113198080 Peak Map Physical memory (bytes)=2508402688 Peak Map Virtual memory (bytes)=9314967552 Peak Reduce Physical memory (bytes)=395964416 Peak Reduce Virtual memory (bytes)=9350410240 Shuffle Errors BAD_ID=0 CONNECTION=0 IO_ERROR=0 WRONG_LENGTH=0 WRONG_MAP=0 WRONG_REDUCE=0 File Input Format Counters Bytes Read=50 File Output Format Counters Bytes Written=41 [[REDACTED]@[REDACTED] ~]$ hdfs dfs -ls /user/[REDACTED]/output Found 2 items -rw-r–r– 3 [REDACTED] hdfs 0 2022-12-20 21:15 /user/[REDACTED]/output/_SUCCESS -rw-r–r– 3 [REDACTED] hdfs 41 2022-12-20 21:15 /user/[REDACTED]/output/part-r-00000 [[REDACTED]@[REDACTED] ~]$ hdfs dfs -cat /user/[REDACTED]/output/part-r-00000 Bye 1 Goodbye 1 Hadoop 2 Hello 2 World 2
# check os version # learn from https://get.docker.com get_distribution() {
if command_exists lsb_release; then dist_version="$(lsb_release --release | cut -f2)" fi if [ -z "$dist_version" ] && [ -r /etc/os-release ]; then dist_version="$(. /etc/os-release && echo "$VERSION_ID")" fi echo "$dist_version" }
curl -v -X POST http://ip:8768/sms/cmppSender -F phoneNumbers="$phone" -F "smContent=$sms"
启动 webhook
1
./webhook -hooks hooks.yaml -verbose
收到的短信效果
1 2 3 4
[!!警告!!] "PrometheusTargetMissing" "A Prometheus target has disappeared. An exporter might be crashed. VALUE = 0 LABELS = map[__name__:up instance:sbi193:9100 job:canal_xxxxx]"
恢复的短信
1 2 3 4
[xx恢复xx] "PrometheusTargetMissing" "A Prometheus target has disappeared. An exporter might be crashed. VALUE = 0 LABELS = map[__name__:up instance:sbi193:9100 job:canal_xxxx]"
if [ -f $LockFile ];then echo "Compare time:" Time=`date +%s` LogTime=`stat -c %Y $LockFile` if [ $[$Time - $LogTime ] -lt 900 ];then echo "Another process is running." exit 1; else rm -f $LockFile; kill -15 `pgrep exporter.sh`; exit 1; fi fi
touch $LockFile;
# make sure sub-dir put in front /usr/local/bin/directory-size.sh /data/input/ /data/output/ > /tmp/metrics.prom.$$ && mv /tmp/metrics.prom.$$ /var/lib/node_exporter/textfile_collector/metrics.prom
#!/bin/sh # # Expose directory usage metrics, passed as an argument. # # Usage: add this to crontab: # # */5 * * * * prometheus directory-size.sh /var/lib/prometheus | sponge /var/lib/node_exporter/directory_size.prom # # sed pattern taken from https://www.robustperception.io/monitoring-directory-sizes-with-the-textfile-collector/ # # Author: Antoine Beaupré <anarcat@debian.org> echo "# HELP node_directory_size_bytes Disk space used by some directories" echo "# TYPE node_directory_size_bytes gauge" du --block-size=1 --summarize "$@" \ | sed -ne 's/\\/\\\\/;s/"/\\"/g;s/^\([0-9]\+\)\t\(.*\)$/node_directory_size_bytes{directory="\2"} \1/p'
Caused by: java.io.IOException: Couldn’t run retriable-command
1 2 3 4 5
Caused by: java.io.IOException: Couldn't run retriable-command: Copying hdfs://<REDACTED>/20220331/13/<REDACTED>_2022033113_20220331130307_<REDACTED>.dat to hdfs://<REDACTED>:8020/apps/5G_N1N2/20220331/30/<REDACTED>_2022033113_20220331130307_<REDACTED>.dat at org.apache.hadoop.tools.util.RetriableCommand.execute(RetriableCommand.java:101) at org.apache.hadoop.tools.mapred.CopyMapper.copyFileWithRetry(CopyMapper.java:296) ... 10 more Caused by: java.io.IOException: Check-sum mismatch between hdfs://<REDACTED>/20220331/13/<REDACTED>_2022033113_20220331130307_<REDACTED>.dat and hdfs://<REDACTED>:8020/<REDACTED>/20220331/30/.distcp.tmp.attempt_1642595741320_786418_m_000088_2. Source and target differ in block-size. Use -pb to preserve block-sizes during copy. Alternatively, skip checksum-checks altogether, using -skipCrc. (NOTE: By skipping checksums, one runs the risk of masking data-corruption during file-transfer.)
在我们的生产环境有多套 Hadoop 集群,这些集群都配置了 Kerberos 安全鉴权,有次的需求是要将其中一个集群(D)上的 hdfs 数据同步到另一个集群(C),需要做信任关系。因为 D 集群比较重要,我们想尽量让 C 集群重启而不让 D 重启,所以考虑只做单向信任,在 C 集群增加 D 的访问,这样只用重启 C 集群。
D –> C
C 集群主体 OSS2.COM ( HDP-3.1.5.0 ) D 集群主体 OSS3.COM ( HDP-2.6.4.0 )
The mapping from kerberos principal names to local OS mapreduce.job.user.names. So the default rule is just "DEFAULT" which takes all principals in your default domain to their first component. "omalley@APACHE.ORG" and "omalley/admin@APACHE.ORG" to "omalley", if your default domain is APACHE.ORG. The translations rules have 3 sections: base filter substitution The base consists of a number that represents the number of components in the principal name excluding the realm and the pattern for building the name from the sections of the principal name. The base uses $0 to mean the realm, $1 to mean the first component and $2 to mean the second component.
[1:$1@$0] translates "omalley@APACHE.ORG" to "omalley@APACHE.ORG" [2:$1] translates "omalley/admin@APACHE.ORG" to "omalley" [2:$1%$2] translates "omalley/admin@APACHE.ORG" to "omalley%admin"
The filter is a regex in parens that must the generated string for the rule to apply.
"(.*%admin)" will take any string that ends in "%admin" "(.*@ACME.COM)" will take any string that ends in "@ACME.COM"
Finally, the substitution is a sed rule to translate a regex into a fixed string.
"s/@ACME\.COM//" removes the first instance of "@ACME.COM". "s/@[A-Z]*\.COM//" removes the first instance of "@" followed by a name followed by ".COM". "s/X/Y/g" replaces all of the "X" in the name with "Y"
So, if your default realm was APACHE.ORG, but you also wanted to take all principals from ACME.COM that had a single component "joe@ACME.COM", you'd do:
RULE:[1:$1@$0](.@ACME.ORG)s/@.// DEFAULT
To also translate the names with a second component, you'd make the rules:
在 C 和 D 上创建一个同名的 ipa 用户,密码/加密方式都一样,加密方式一般没有专门去指定,那就不用管
在使用 D 集群凭证的客户端机器上,使用 ip 方式,hdfs dfs -ls ,查看 C 集群文件
ip 使用 C 集群的 active namenode 的 ip
如果能查看就代表通了
我们之前的 跨集群拷贝脚本中涉及到的集群版本比较老,所以脚本中通过这样的方式获取 active nn 的 ip
1 2 3 4 5 6 7 8 9 10
getActiveNameNode(){ namenodes='10.110.123.1 10.110.123.2' for namenode in${namenodes} do curl -s "http://${namenode}:50070/jmx?qry=Hadoop:service=NameNode,name=NameNodeStatus" | grep 'active' > /dev/null if [ $? -eq 0 ]; then active_namenode=${namenode} fi done }
C 集群是 HDP 3.x 的版本,访问 50070 都需要 kerberos 认证,我也没找到别的办法可以认证,于是采用了绕路的方式(骚方法),hdfs dfs -ls 能看的,自然就是 active nn ip 了(呲牙)
1 2 3 4 5 6 7 8 9 10
getActiveNameNode(){ namenodes='10.110.123.1 10.110.123.2' for namenode in${namenodes} do hdfs dfs -ls hdfs://${namenode}:8020/ > /dev/null if [ $? -eq 0 ]; then active_namenode=${namenode} fi done }
@@@@@@@@@@@@@@@@@@@@@@@@@@@@@@@@@@@@@@@@@@@@@@@@@@@@@@@@@@@ @ WARNING: REMOTE HOST IDENTIFICATION HAS CHANGED! @ @@@@@@@@@@@@@@@@@@@@@@@@@@@@@@@@@@@@@@@@@@@@@@@@@@@@@@@@@@@ IT IS POSSIBLE THAT SOMEONE IS DOING SOMETHING NASTY! Someone could be eavesdropping on you right now (man-in-the-middle attack)! It is also possible that a host key has just been changed. The fingerprint for the ED25519 key sent by the remote host is 24:48:c9:a3:de:04:57:9f:f8:a5:ab:28:e0:d6:1a:bb.
-f filename Specifies the filename of the key file.
-R hostname | [hostname]:port Removes all keys belonging to the specified hostname (with optional port number) from a known_hosts file. This option is useful to delete hashed hosts (see the -H option above).
ssh option -o ssh_option Can be used to pass options to ssh in the format used in ssh_config(5). This is useful for specifying options for which there is no separate sftp command-line flag. For example, to specify an alternate port use: sftp -oPort=24. For full details of the options listed below, and their possible values, see ssh_config(5).
@@@@@@@@@@@@@@@@@@@@@@@@@@@@@@@@@@@@@@@@@@@@@@@@@@@@@@@@@@@ @ WARNING: REMOTE HOST IDENTIFICATION HAS CHANGED! @ @@@@@@@@@@@@@@@@@@@@@@@@@@@@@@@@@@@@@@@@@@@@@@@@@@@@@@@@@@@ IT IS POSSIBLE THAT SOMEONE IS DOING SOMETHING NASTY! Someone could be eavesdropping on you right now (man-in-the-middle attack)! It is also possible that a host key has just been changed. The fingerprint for the ED25519 key sent by the remote host is 24:48:c9:a3:de:04:57:9f:f8:a5:ab:28:e0:d6:1a:bb.
注意: ED25519 key
实际用的是 /etc/ssh/ssh_host_ed25519_key.pub 这个文件
使用 ssh-keygen 计算指纹
1 2
ssh-keygen -E md5 -lf /etc/ssh/ssh_host_ed25519_key.pub 256 MD5:24:48:c9:a3:de:04:57:9f:f8:a5:ab:28:e0:d6:1a:bb no comment (ED25519)
可以看到和报错信息是一样了吧
]]>
<h2 id="背景"><a href="#背景" class="headerlink" title="背景"></a>背景</h2><p>这其实是2021年的事情了,当时是要通过 SFTP 从另一个厂商的服务器下载数据,那个服务器的 IP 是浮动 IP,主备机共用一个 IP ,
离线环境下部署 cephhttps://blog.meow.page/archives/offline-install-ceph/2022-04-10T00:00:34.000Z2024-01-09T17:16:17.401Z因为要在 k8s 内使用存储,考虑删除容器后文件还能持久保存,所以要装个分布式文件存储系统,当前比较火的莫过于 ceph 了。
[ceph-2][ERROR ] admin_socket: exception getting command descriptions: [Errno 2] No such file or directory [ceph-2][WARNIN] ceph-2 is not defined in `mon initial members` [ceph-2][WARNIN] monitor ceph-2 does not exist in monmap [ceph-2][WARNIN] neither `public_addr` nor `public_network` keys are defined for monitors [ceph-2][WARNIN] monitors may not be able to form quorum [ceph-2][INFO ] Running command: ceph --cluster=ceph --admin-daemon /var/run/ceph/ceph-mon.ceph-2.asok mon_status [ceph-2][ERROR ] admin_socket: exception getting command descriptions: [Errno 2] No such file or directory [ceph-2][WARNIN] monitor: mon.ceph-2, might not be running yet
[root@ceph-1 ceph-cluster]# ceph mon stat e3: 3 mons at {ceph-1=[v2:10.101.235.84:3300/0,v1:10.101.235.84:6789/0],ceph-2=[v2:10.101.235.217:3300/0,v1:10.101.235.217:6789/0],ceph-3=[v2:10.101.235.38:3300/0,v1:10.101.235.38:6789/0]}, election epoch 12, leader 0 ceph-1, quorum 0,1,2 ceph-1,ceph-2,ceph-3
[root@ceph-1 ceph-cluster]# openssl req -new -nodes -x509 -subj "/O=IT/CN=ceph-mgr-dashboard" -days 3650 -keyout dashboard.key -out dashboard.crt -extensions v3_ca Generating a 2048 bit RSA private key .....................................+++ ........+++ writing new private key to 'dashboard.key' -----
ceph config-key set mgr mgr/dashboard/crt -i dashboard.crt ceph config-key set mgr mgr/dashboard/key -i dashboard.key ceph config-key set mgr/dashboard/ceph1/crt -i dashboard.crt
1
2
3
4
5
6
7
[root@ceph-1 ceph-cluster]# ceph config-key set mgr mgr/dashboard/crt -i dashboard.crt set mgr [root@ceph-1 ceph-cluster]# ceph config-key set mgr mgr/dashboard/key -i dashboard.key set mgr [root@ceph-1 ceph-cluster]# ceph config-key set mgr/dashboard/ceph1/crt -i dashboard.crt WARNING: it looks like you might be trying to set a ceph-mgr module configuration key. Since Ceph 13.0.0 (Mimic), mgr module configuration is done with `config set`, and new values set using `config-key set` will be ignored. set mgr/dashboard/ceph1/crt
Remove it: ceph osd rm osd.11. If it says ‘Error EBUSY: osd.11 is still up; must be down before removal.’ that means OSD is not dead yet. Go to the host it resides on and kill it (systemctl stop ceph-osd@11), and repeat rm operation.
Now it would list in ceph osd tree with ‘DNE’ status (DNE = do not exists). To clean up this status, remove it from CRUSH map: ceph osd crush rm osd.11
Last step: remove it authorization (it should prevent problems with ‘couldn’t add new osd with same number’): ceph auth del osd.
我所在办公环境,需要使用一个终端安全助手,登录输入口令和每天变化的验证码才能接入到办公网络和外网。登录前会检查一些必要的安全策略,包括但不限于是否运行杀毒软件、是否安装重要的系统安全补丁等等,而且这个软件只能在 Windows 上运行,导致开 Wi-Fi 只能通过电脑开热点,但是登录前也会检查网络共享,然而并没有检查出来,可能是放水了。
开始一大堆介绍听不懂,不用管,然后开始问问题了,她顿了下,我才意识到该我说话了,我说 yes,我这里网络不好,你能说慢点么(can you speak slowly?).
又一大段听不懂的,好像是问申请账户的原因,我说 yes 我注册自己用的。
让我伸出5根手指,放在脸的旁边。
look at front camera,看着前置摄像头,拍个大头贴。
好了后,APP 切换到后置摄像头,看护照,拍照,让我 hold 护照,我没听懂,把护照关上了,她说打开护照,我打开了,她说 hold it,我又给关上了放桌上了。她说,不要关掉。我说,不是你让我 hold 吗。她说,让你 hold,没让你关掉。好吧。。。。拍照期间会自动调用闪光灯。
拍完后,让我把 up right 的区域对着摄像头,然后什么什么 from side to side,就是让我调整角度,这样她可以看到防伪水印。
完了后,让我读一遍 passport number。
读完后关掉护照,并且摄像头拍着护照封面。在我看不到护照内容的情况下问问题,问我 when were you born,我网络真的不好,when 听成了 where,我说 China,她一脸蒙蔽,我说,你问啥来着,她说 I said when….。 我说,嗷,you say when 嗦(心里OS:你说 birthday 不就完了吗)。然后心想,生日,我生日多久来着,我是先说月份还是先说日呢,卡了5秒钟才说出来。
完了后,问我能不能收验证码,这时候 APP 已经切换到确认手机号的步骤,我还问她是不是 click 那个 button ,她说是,然后收到验证码填上,她说已经验证我的账户,可以开始使用了,have a good day。我说 thank you。
Responsibilities: translate app and website interfaces, posts on the Telegram blog, articles and more.
Requirements: fluency in English and at least one other language.
Site Reliability Engineer
Responsibilities: automate routine tasks, proactively identify and solve potential reliability issues, increase fault-tolerance of Telegram’s multi-datacenter infrastructure.
Preferred qualifications: experience administering *nix like systems, experience developing in C, Python or Perl; knowledge of bash, network protocols, and network equipment of major manufacturers.
其他的还有:
C/C++ Software Engineer
Junior Accountant
Assistant to the CEO
最终我还是选择 Translator
后来我就忘了这事,谁知道他们是不是真的在招聘呢,直到。。。。
考前测试
2021-08-19 23:55 (UTC+8)
收到 @jobs_bot 发来的通知
Thank you very much for expressing an interest in joining Telegram as a Translator. We would like to offer you a series of test tasks to make sure that we fit well together.
The first stage will require you to complete a test of your English skills (you will receive a separate announcement with all the details).
Before that, we invite you to participate in a preliminary test — an easy quiz that will not be used for evaluation. This is not a requirement, but we highly recommend to participate because it will introduce you to all the necessary features of the Quiz Platform.
The preliminary test will start on August 20, 18:00 UTC and take less than 30 minutes. Here is the quiz link: https://quiz.directory/quiz/PM0jsfZ9
In case you encounter any issues with the interface, please report them to this dedicated bug report account: @test_feedback.
During the quiz, please note that the interface does not allow changing your answer after clicking on one of the answer options.
The quiz will stay open for 30 minutes and you can take it several times to get used to the interface.
If you encounter any problems during the quiz (e.g. media fails to load, long response times from the interface or other issues), please report them to this dedicated bug report account: @test_feedback.
As a reminder, this quiz will NOT be used for evaluation — so don’t worry about choosing the wrong answers.
考完了后,等到结束时间可以看到题目的正确答案,答对的题目数,以及自己的排名
正式测验
预先测试的当天晚上
2021-08-21 22:10 收到通知
As part of the first evaluation task, we would like to invite you to complete a series of aptitude tests on Sunday, August 22. The tests will start exactly at 15:00 UTC and will take approximately 3 hours.
We understand that this invitation comes with very short notice. If you are unable to take the tests this Sunday, there will be another opportunity in September or October of this year.
That said, urgent translation tasks with ambitious deadlines that appear at unexpected times are not uncommon at Telegram, so it will definitely count as bonus points for your application if you are able to take the tests tomorrow.
We will send you more information about the tests on Sunday, before the task starts.
You will need:
A computer with internet access (desktop preferred).
A pen and paper for notes.
Do this now:
Check your local time! (UTC time now) The task will open at 15:00 UTC and close at 18:00 UTC, you will not have time to complete it if you are late.
Log in on quiz.directory ahead of time to ensure you are able to start the task at exactly 15:00 UTC.
总算不是阴间时间了,我本地时间的晚上 11 点开始,考试时长 3 小时,有3个部分。
诶,为什么要准备纸笔?
2021-08-22 收到考试的详细内容
You have applied as a Telegram translator. Today, you are invited to take three aptitude tests one after another.
There will be another opportunity to take the tests for the translator vacancy later this year, however, we recommend that you take the tests today if you have the opportunity as this will count as bonus points for your application. You will only be able to take each of the tests once.
If you complete the tests in less than the maximum time, you will have longer breaks between tests. Don’t hurry too much — correct answers are more important than speed.
Please complete all of the tests Many of the questions were intended to be difficult — and you are likely to make at least some mistakes. But don’t worry! The goal here is not to get 100% correct results, but rather to demonstrate how you solve progressively more difficult tasks under stress. We advise you to finish the tests no matter what.
Test 1. English Language English is the universal language of communication at Telegram. As a translator, it is vital for you to demonstrate exceptional English skills because translating interfaces and other texts requires a deep understanding of the finest details in the original text, especially when it comes to manuals, blog posts, etc.
Test 2. Logic/Spatial These questions will help you show off how you handle logical tasks. While they are not directly connected with any of the activities you might perform as a potential member of our team, they will help us learn more about you and which types of tasks and formats of work are best suited for you.
Test 3. Math While math skills are not required for the position you applied for, we would be grateful if you could also complete the full math test — even if you find it difficult. This will help us to know you a little better and may help to unlock additional opportunities, should you become a member of our team. You are welcome to use a calculator for the math tasks.
=== We will send another notification immediately before the task, but you are welcome to begin as soon as the task opens at 15:00 UTC.
竟然有数学题,好吧,这就是准备纸笔的原因吧。
又是考试前 8 分钟
The aptitude tests are about to begin. Please open the English language test and be ready to start at 15:00 UTC.
– It was so quietly in the room, that I could hear the beating of my own heart. – It was so quiet in the room, that I could hear the beating of my own heart. – Quietly in the room, that I could hear the beating of my own heart. – So quiet is in the room, that I could hear the beating of my own heart.
2. Select the (❌) WRONG sentence.
– Two of the children are going? – The two of us will be late. – Two cats are playing outside. – The two women want too go swimming to.
3. Select the (✅) CORRECT sentence.
– This was all an horrible misunderstanding. – You are a honorable guest. – Her brother owns a horse. – Maybe you should try visiting an hotel. – It was a honest mistake.
4. What is the (✅) CORRECT ordering of the following five words: 'likes', 'everyone', 'chocolate', 'cold', 'milkshakes'?
5. What is the (✅) CORRECT ordering of the following five words: 'outside' 'going' 'we' 'are' 'not'?
– We are not outside going. – We are not going outside. – We not going are outside. – We not are going outside. – We are going not outside.
6. Select the (✅) CORRECT sentence.
– This is an honest opinion. – Do you need a another juice? – This is an hobby I like. – This is the route to an supermarket. – I don't have an any idea.
7. Select the (✅) CORRECT sentence.
– Off course, I switched the light off. – Of course, I switched the light of. – Of course, I switched the light off. – Off course, I switched the light off.
8. Select the (❌) WRONG sentence.
– Where you seen after you were in the store? – Were there more people where you went to? – We’re where we were with the girls yesterday. – Where were we when we played tennis last week?
9. Read the following sentence:
It happened because of me, so I decided it would be fair if I paid _____ the damage _____ the other car.
Which option (✅) CORRECTLY fills the gaps? – about, of – about, to – for, to – for, for – to, to – to, for
10. Select the (❌) WRONG sentence.
– So far, the government has been unable to effect an improvement in the well-being of its citizens. – Many experts are unable to explain this effect. – The loss of his only daughter had a terrible affect on Steven's psyche. – There is a social movement trying to affect the decisions being made by the government. – The medicine did not appear to have any effect on the strange patient.
11. Read the following sentence: My financial advisors _____ my lifetime welfare. They consistently _____ me with only the best available policies.
12. Read the following text: Isn’t it obvious? The guards release the prisoners and then present themselves as heroes.
They are getting paid from our taxes, so _____
Which option (✅) CORRECTLY fills the gaps?
– they need to justify them own existence. – they need to justify there own existence. – they need to justify they're own existence. – they need to justify their own existence. – they need to justify they own existence.
13. Select the (❌) WRONG sentence.
– After being stagnant for six months, business is finally starting to pick up. – Pick up after your dog! – My mother is coming to pick me up at four o'clock. – Although he was polite, I could pick up a hint of irritation in his voice. – The class is picking up too much time, so I think I'm going to drop it.
14. Read the following text: _____ the quadruplets, Thomas stands the best chance of being recognized by the school _____.
Which option (✅) CORRECTLY fills the gaps?
– between, principal – among, principal – between, principle – among, principle
15. Read the following text:
Carl insisted that _____ deliberately left the apartment unlocked. Of course, nothing could be _____ from the truth. _____, he claimed that the police were already investigating.
Which option (✅) CORRECTLY fills the gaps?
– further, father, further – further, father, farther – farther, farther, farther – father, further, farther – father, further, further – farther, farther, further
16. Read the following text:
Studies claim that chocolate may be beneficial to human health and cause mood improvement, despite its calories and the amount of fat and sugar.
However, excessive consumption may result in headaches and diabetes. In order to avoid possible harm, it is recommended that cocoa-heavy chocolate is ingested, but in moderate amounts.
Select the (❌) WRONG interpretation.
– Chocolate with a greater cocoa amount has a lower risk of causing harm. – Eating chocolate may improve your mood. – Only a reasonable amount of chocolate should be consumed. – Eating chocolate is always beneficial.
17. Read the following text:
He heard one of them whisper to the other, "That is Dorian Gray." He remembered how pleased he used to be when he was pointed out, or stared at, or talked about. He was tired of hearing his own name now. Half the charm of the little village where he had been so often lately was that no one knew who he was.
Select the (✅) CORRECT interpretation.
– Dorian Gray is pleased that people recognize him. – Dorian Gray is happy that no one knows him in a village he visits. – Dorian Gray is very popular in the little village. – Dorian Gray is tired of the fact that no one knows him.
18. Read the following text:
The United Nations are determined to save succeeding generations from routinely-occurring sorrow. To that end they will unite their strength to maintain international peace and security, and to ensure, by the acceptance of principles and the institution of methods, that armed force shall not be used except for in pursuit of the greater good. They have resolved to redouble their efforts to accomplish these aims.
Select the (✅) CORRECT interpretation.
– The United Nations will maintain international peace and security by routinely using armed force. – The United Nations will use armed force to accomplish its aims. – The United Nations will often use armed force. – The United Nations will never use armed force. – The United Nations will use armed force only if it's in the common interest.
19. Read the following text:
We don't need _____ pineapples, buy watermelon!
Which option (✅) CORRECTLY fills the gap?
– each – any – much – some
20. Read the following conversation:
Kevin: Can we arrange a meeting today? I want to discuss some details about the project.
Bob: Of course. Can I suggest that we meet at the restaurant near the office for the meeting?
Kevin: I'm quite sick, and not so hungry! Do you mind if we meet in the library instead?
Bob: There's actually some maintenance work going on there, how about central park? It's not too far from the library in fact!
Kevin: That's better than nothing, although it won't be as quiet as the library. Let's do it.
Bob: Wait! 💡 Last-minute proposal: Andy's bakery.
Kevin: Sure. Great idea. I love food poisoning. 👍
Bob: Haha, maybe not then. See you later!
Select the (✅) CORRECT interpretation.
– They chose the restaurant nearby the office. – They chose Andy's bakery. – They chose Central Park. – They chose the Library.
21. Select the (✅) CORRECT sentence.
– It's the army that's attacking us! Then they talk about there discipline and strength. – It's the army that's attacking us! Than they talk about there discipline and strength. – It's the army that's attacking us! Than they talk about their discipline and strength. – It's the army that's attacking us! Then they talk about their discipline and strength.
22. Read the following text:
If you _____ taken the exam more seriously, you _____ have stud___ more.
Nelson Dellis's motive is personal. His paternal grandmother, who died in 2009, suffered from Alzheimer’s. He visited his grandparents in France once or twice a year, and that "spaced-out time" made the deterioration of her mental faculties especially poignant. At dinner a year before her death, "my grandmother looked to my grandfather and said something to the effect of 'Where is Nelson?' or 'How is Nelson doing?' " he recalls—"and I’m right there."
Nelson was stunned: "I couldn’t believe that she could forget—I mean, she hadn’t forgotten, because she was talking about me." But she was unable to connect her memory to the young man at her table. "I had the idea of 'I don’t want that to happen to me.' "
Select the (❌) WRONG statement.
– In 2009, Nelson's grandmother died. – 2 years after the described incident, Nelson's grandmother died. – Nelson's grandmother did not recover from Alzheimer’s. – Nelson's grandmother was unable to recognize him at dinner.
24. Read the following text:
The Hawaii Space Exploration Analog and Simulation (HI-SEAS) is an analog habitat for human spaceflight to Mars. HI-SEAS is located in an isolated position on the slopes of the Mauna Loa volcano on the island of Hawaii.
The purpose of the detailed research studies is to determine what is required to keep a space flight crew happy and healthy during an extended mission to Mars and while living on Mars. Research into food, crew dynamics, behaviors, roles and performance, and other aspects of space flight and a mission on Mars itself is the primary focus. One thing under study by NASA is trying to understand crew dynamics such as morale, stress management, and how they solve problems as group.
Select the (✅) CORRECT interpretation.
– The project includes studies on Mars' atmosphere. – The HI-SEAS project is sending humans to Mars. – The project studies human behavior. – NASA isn't studying stress management and group dynamics.
25. Read the following text:
For decades, humans have been selectively breeding cats and dogs to exhibit exaggerated features – particularly in their faces. When it comes to cats, the very flat, round faces of the modern Persian and Exotic Shorthair are classic examples. These breeds are likely a result of humans’ preference for infant-like features that may directly tap in to our nurturing instincts.
While it might be cute for humans to look at, there are various downsides for the animals when it comes to looking this way. This can cause all sorts of health issues as well as breathing difficulties and, in dogs, an increased risk of fatal conditions such as heatstroke.
Select the (❌) WRONG statement.
– Due to selective breeding of pets, some cat breeds now exhibit extremely flat and round faces. – Breeding of cats is more focused on optical features, breeding of dogs on behavioral aspects. – Extreme breeding features can lead to health issues and even to fatal conditions in pets. – Cats with faces that resembles the features of human babies activate caring instincts.
26. Read the following text:
After Sarah found a tiny bird that fell out of a nest, because its siblings moved too often, she went to a vet to learn how to raise birds in order to set them free when they become mature.
Which event happened first?
– A bird fell out from the nest. – Sarah wanted to raise the bird. – The fledglings in the nest moved too much. – Sarah visited the vet. – The bird was set free, after becoming mature. – Sarah found the tiny bird.
27. Read the following text:
The events in question occurred in the early days of my association with Holmes, when we were sharing rooms as bachelors in Baker Street.
It is possible that I might have placed them upon record before, but a promise of secrecy was made at the time, from which I have only been freed during the last month by the untimely death of the lady to whom the pledge was given.
Why was the author not able to write about this before now?
– Holmes made him pledge not to. – He was too busy writing about other cases. – He was still sharing a room with Holmes. – He made a promise to his secretary. – He had promised a lady that he wouldn't.
28.Read the following sentences:
A: They like to travel and take photos of famous spots.
B: You like to play the football in the school stadium.
C: Does he like her new swimming pool, in the backyard?
D: I would like to get the advice about my relationship.
E: He really likes history, but does not like literature.
F: Would you like to watch the movies I brought today?
Which two sentences are (❌) WRONG?
– B and D – C and E – F and B – E and A – A and C – D and F
29. Read the following text: Mrs. McSpaсen is an artist and her work requires total immersion, so she works from home. Mr. McLoggy, her husband, occasionally goes on business trips, but mostly works from home too.
Their son is 14 years old and is in high school. He loves to paint, and has already sent his paintings to famous art exhibitions several times.
The entire McLoggy family gets together quite often in the evenings. They read books together, play board games, watch movies, or just talk. Each of them is glad that their life turned out this way.
Select the (✅) CORRECT statement.
– Their son is in middle school. – Mrs. McSpacen chooses not to participate in art exhibitions. – Mrs. McSpacen sometimes plays board games in the evenings. – Mrs. McSpacen occasionally goes on business trips.
30. Read the following text:
Chameleons have two layers within their skin that control their color. The top layer contains a lattice of guanine nanocrystals. Exciting the lattice increases the distance between the nanocrystals, and the skin reflects longer wavelengths of light. Thus, in a relaxed state the crystals reflect blue, but in an excited state the longer wavelengths such as yellow, orange, green, and red are reflected.
The skin of a chameleon also contains some yellow pigments, which combined with the blue reflected by a relaxed crystal lattice results in the characteristic green color which is common of many chameleons in their relaxed state. Chameleon color palettes have evolved through evolution and the environment. Chameleons living in the forest have a more defined and colorful palette compared to those living in the desert or savanna, which have more of a basic, brown, and charred palette.
Generally, while relaxing, chameleons are observed to be green in color, why is this?
– In a relaxed state, the guanine crystal lattice reflects green light. – In a relaxed state, the crystal lattice absorbs the wavelength range of green light. – Blue light reflected by Guanine + yellow pigments available on chameleon skin = green skin color. – Chameleons have natural green skin that undergoes color change with respect to circumstances.
Logic / Spatial thinking test
Quiz: [202108] Telegram Evaluation Quizzes
Questions 30
2 min Per question
Average time 34:10
Community Rating 3.7
Participants 3,062
点击展开题目
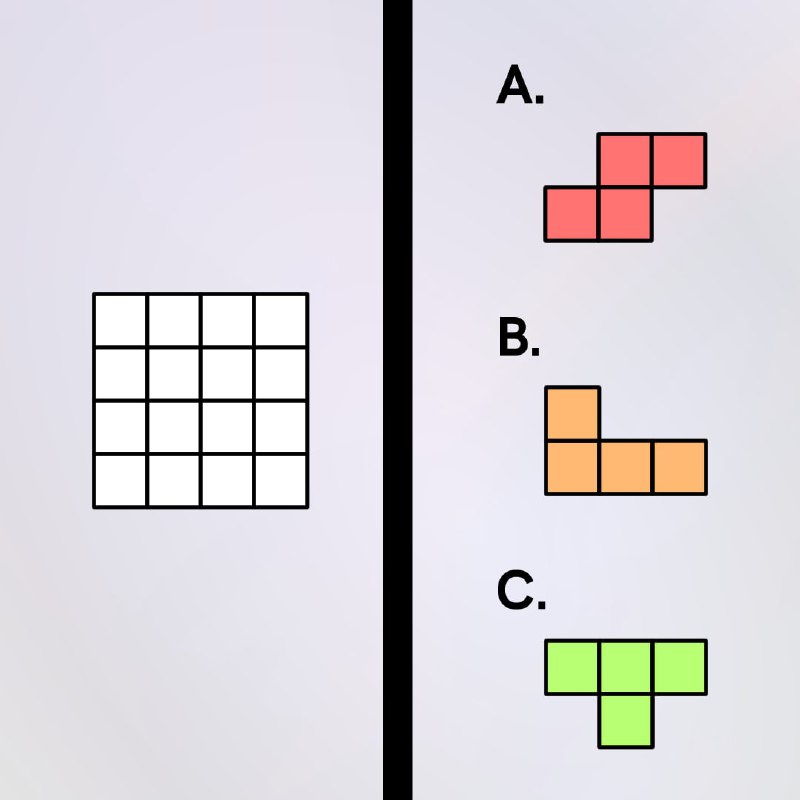
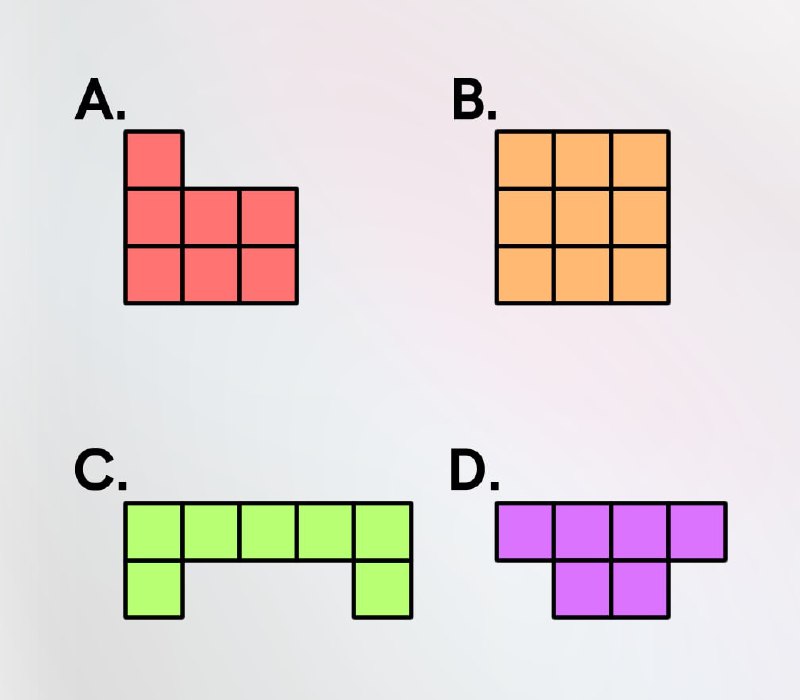
1. Which of the pieces completes the painting, if only rotation is allowed?
– D – A – H – G – B – E – C – F
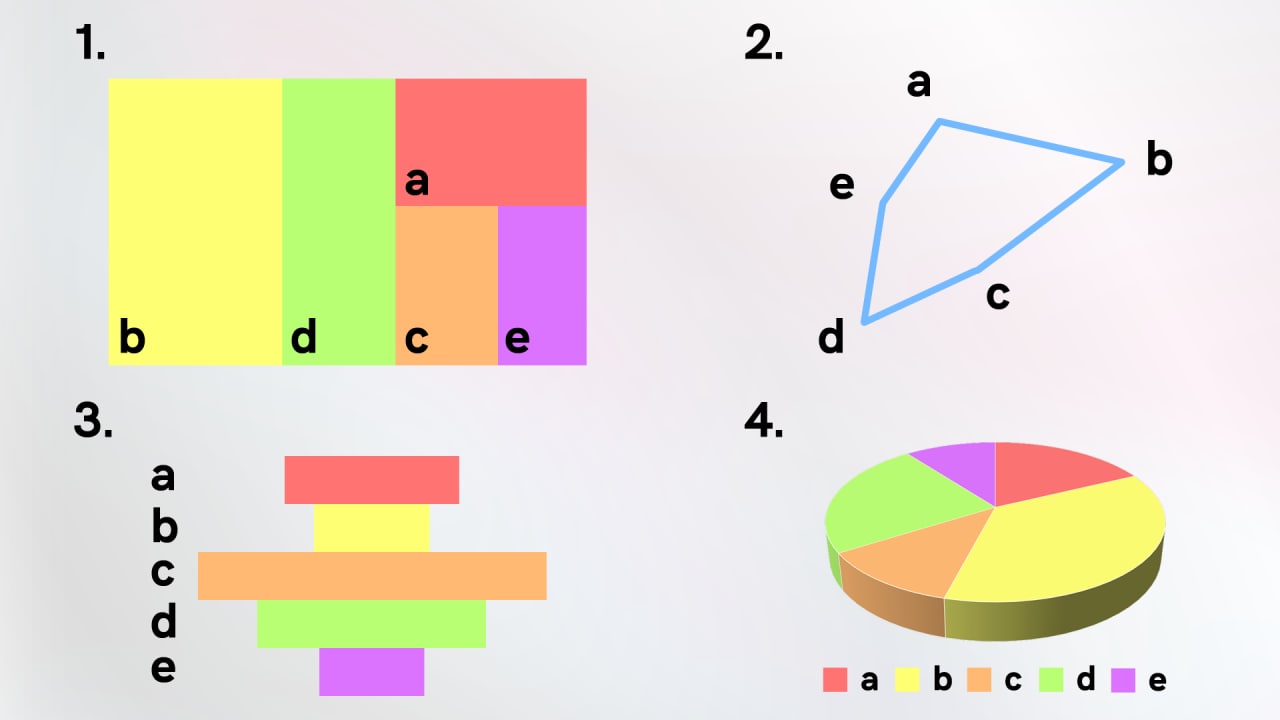
2. You want to fill the 4x4 square. Only rotation of the shapes is allowed. After using one of each shape, which shape must be used again?
– B – A – C
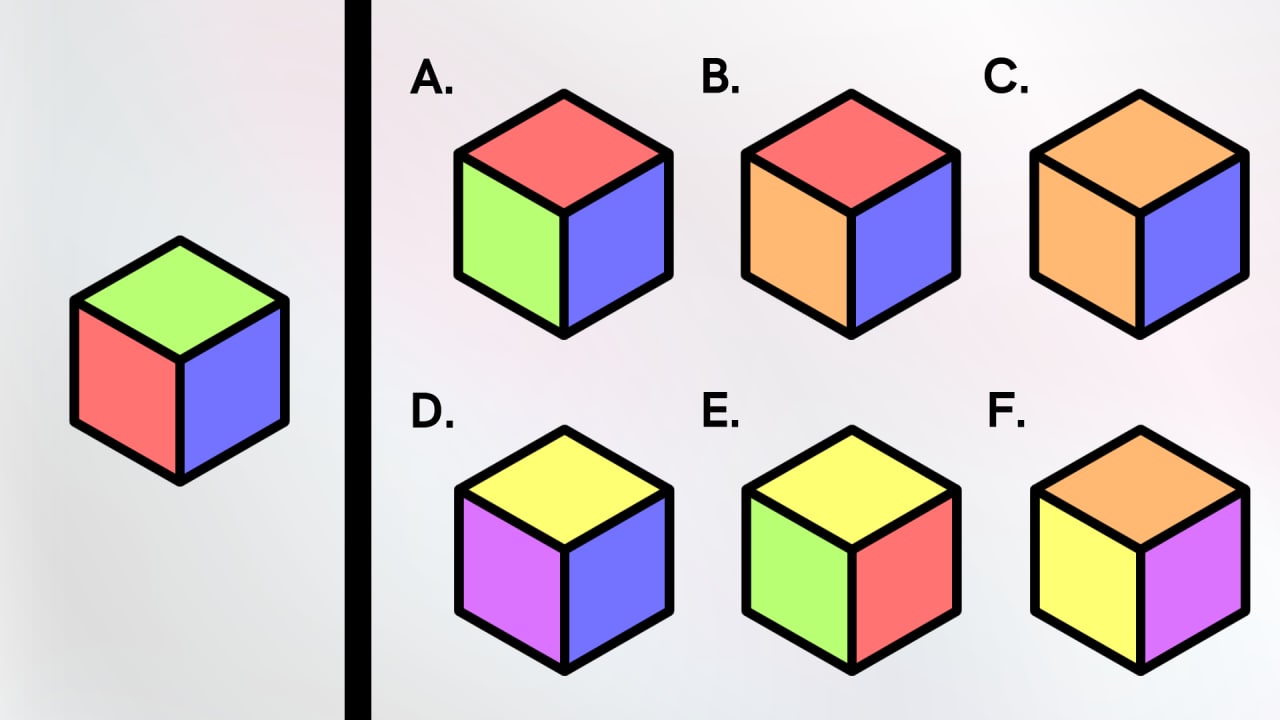
3. A cube is rotated. The cube’s 6 sides are red, green, blue, orange, yellow, and purple. How many perspectives of this cube are NOT possible?
– 6 – 1 – 3 – 0 – 2 – 4 – 5
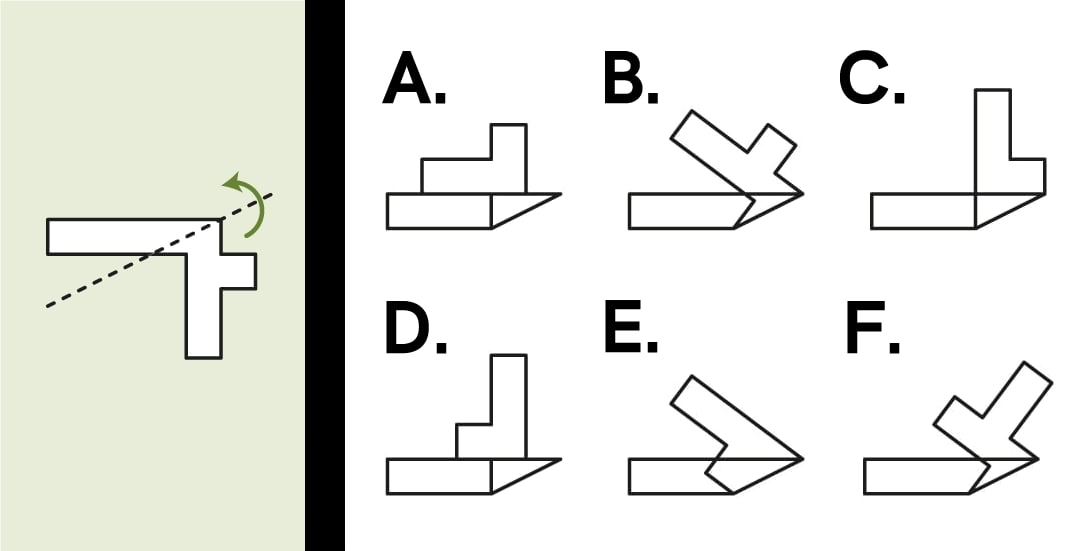
4. The same transformations which were applied to the first photo are applied to the second. What is the result?
– C – D – F – E – A – B
5. Tom stands in front of a set of colored walls, an aerial view is presented on the left. From his position on the ground, what does Tom see?
– C – A – B – D – G – E – H – F
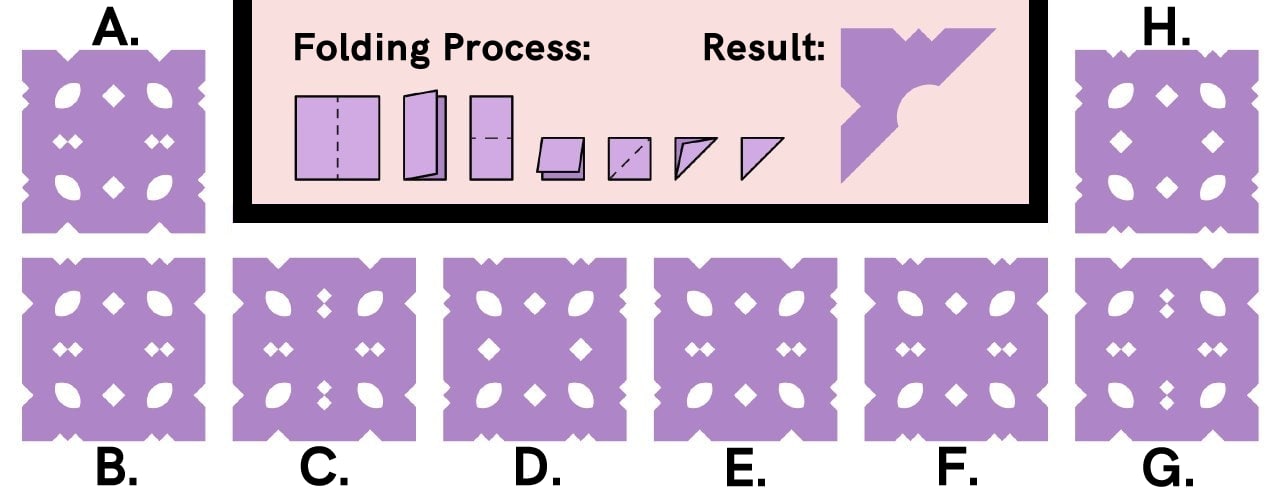
6. A square piece of paper is folded and cut, the result of this is shown, When the paper is unfolded, how will it look?
– D – E – F – H – C – G – B – A
7. A shape is cut from low opacity paper. After being folded along the dashed line, what will the shape look like?
– B – C – D – A – F – E
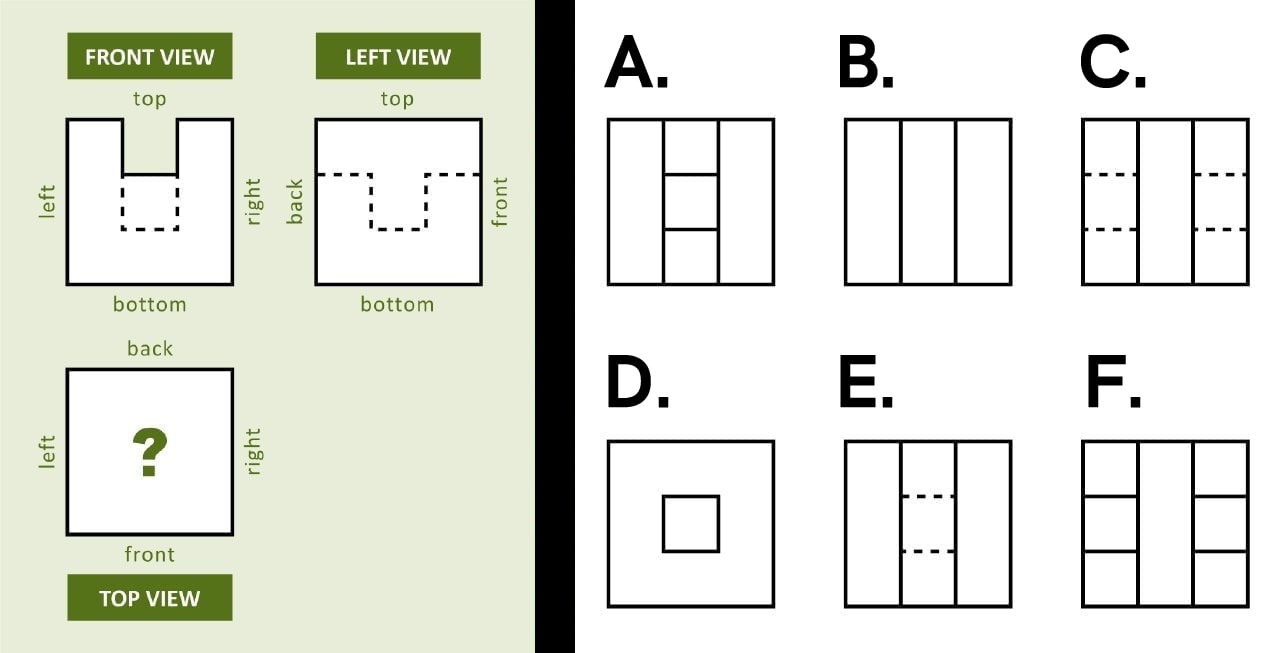
8. The front and left views of a 3D object are shown. Solid lines indicate visible edges, while dashed lines denote edges which exist, but cannot be seen from this view. How will the object look from above?
– D – F – A – B – C – E
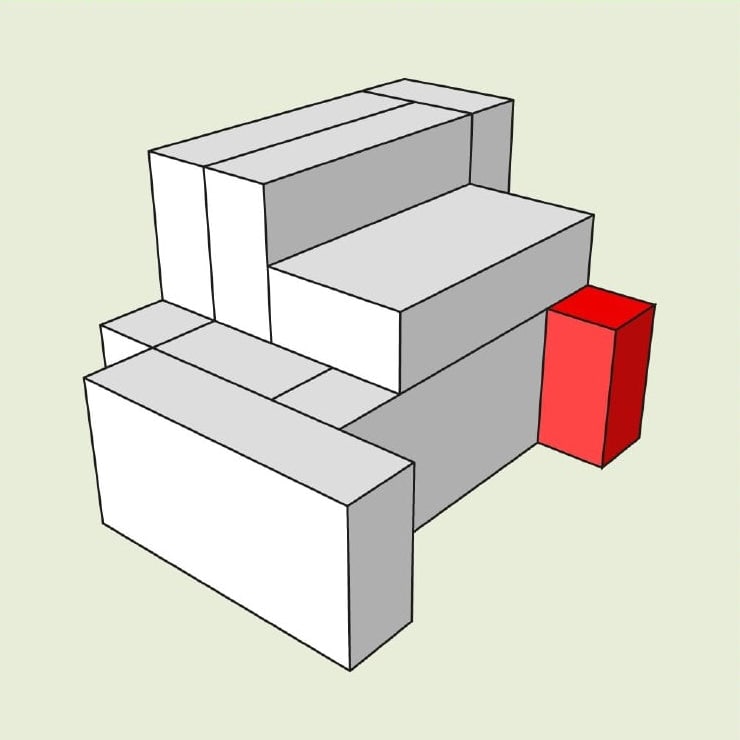
9. There are 9 blocks in the picture. The size of each block is 1 cm x 2 cm x 4 cm. Without considering edge-only touches, how many other blocks does the red block touch?
– 3 – 1 – 7 – 0 – 6 – 8 – 2 – 4 – 5
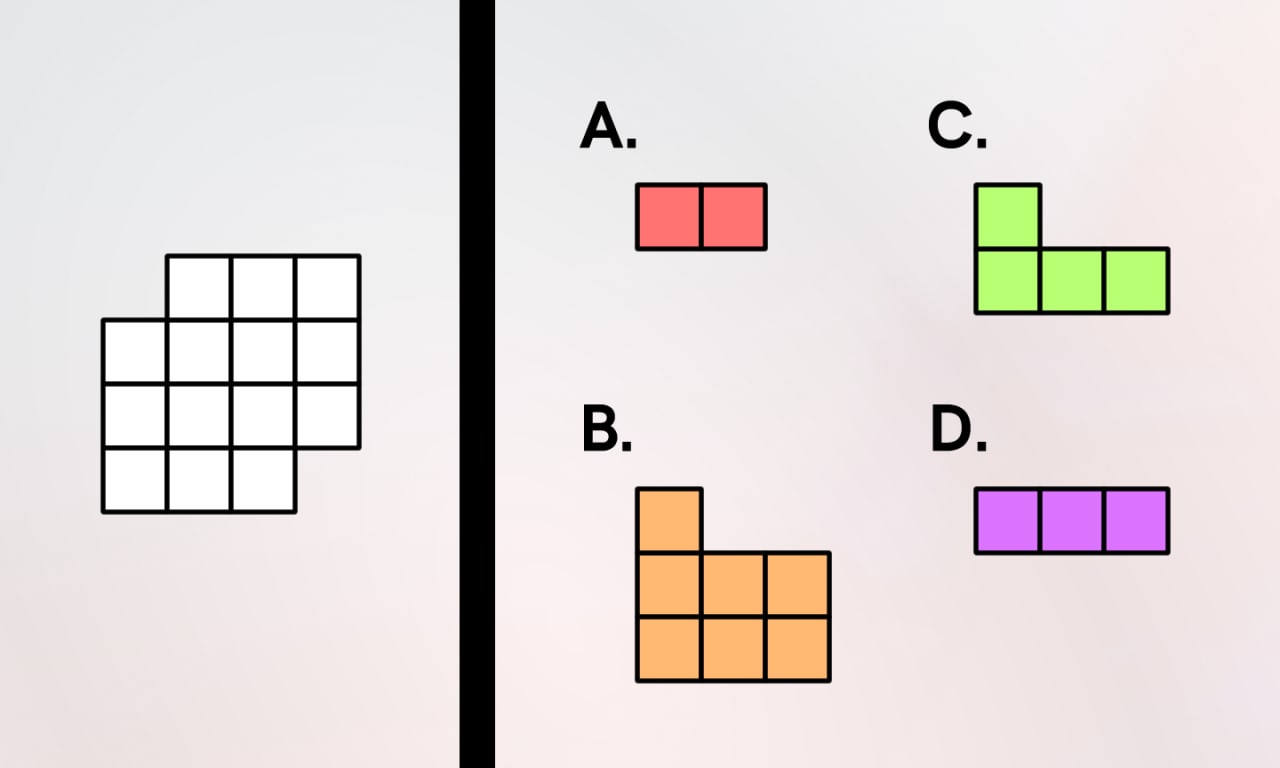
10. Which of the shapes can be used to fully fill the blank area (using duplication and rotation) without any overlaps or empty spaces?
– B – C – D – A
11. Which of these ratios describes the relation between the combined red area, compared to the red + white area?
– 50:145 – 90:75 – 145:100 – 100:200 – 25:25
12. Which of the 4 transformations of the drawing is the odd one out?
– B – A – C – D
13. In which position will the shape be able to pass through both holes?
– D – A – B – C
14. How would this pyramid look when viewed from above?
– A – C – B – D
15. In which position will the shape be able to pass through all of the holes?
– B – C – A – D
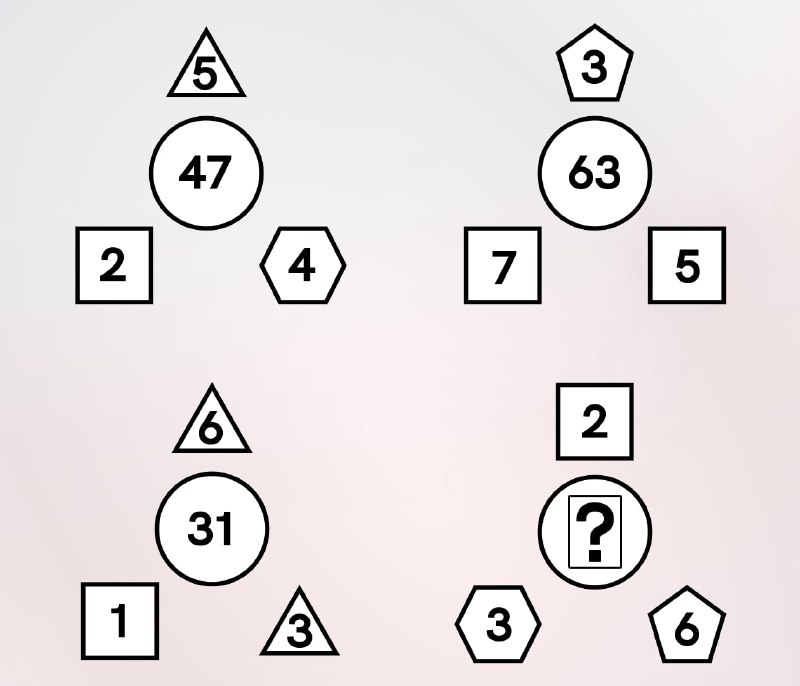
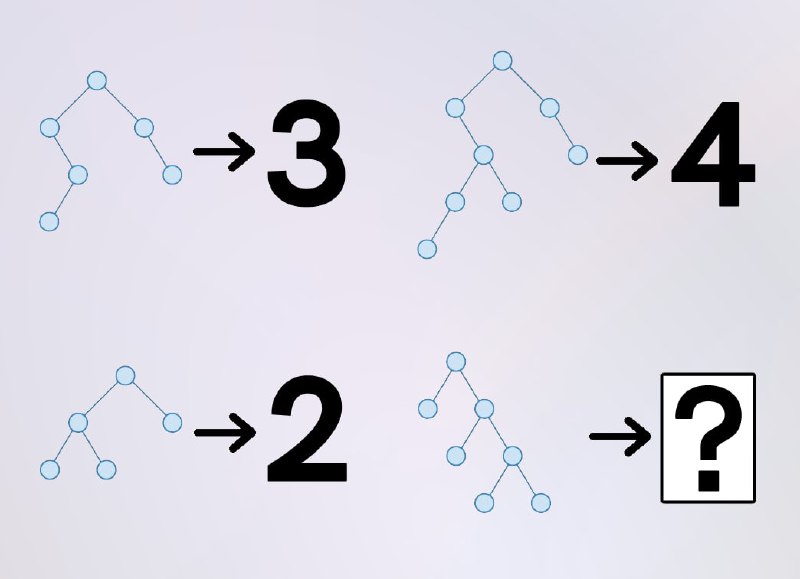
16. Find the missing value.
– 46 – 76 – 56 – 45 – 75 – 15 – 55 – 36
17. There are 4 lights and 4 switches. Each switch corresponds to one light, and each light corresponds to one switch.
Each light can be on (🟡) or off (⚪️). Each switch has two states (🔹 and 🔺) which may have different behavior for each light.
Here are some possible states of the switches and lights: 🔹🔺🔺🔹 ➡️ 🟡🟡🟡⚪️ 🔹🔺🔹🔺 ➡️ ⚪️🟡🟡🟡 🔹🔹🔺🔺 ➡️ ⚪️⚪️🟡⚪️
Which switch positions will ensure that all lights are turned off? ❓❓❓❓ ➡️ ⚪️⚪️⚪️⚪️
18. “6 + 4 = 5” is incorrect. We can correct this by moving the position of ONE matchstick. Where should this matchstick be taken from?
– from the second digit (4) – from the sign (+) – from the first digit (6) – from the third digit (5)
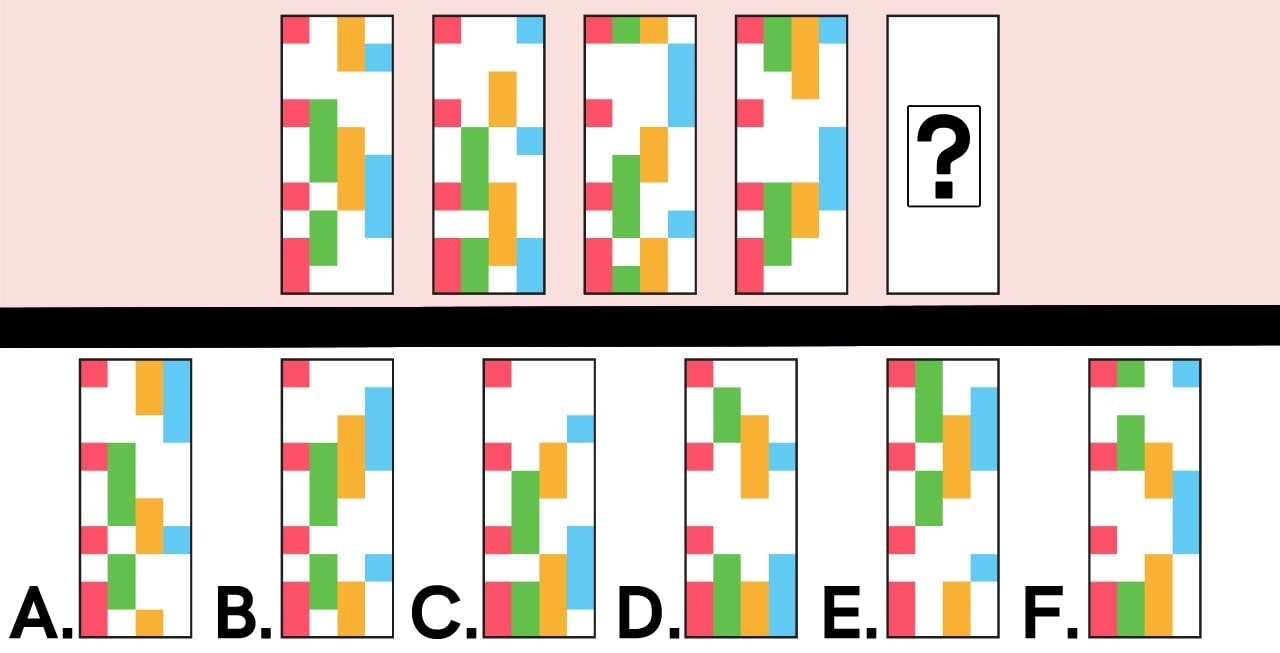
19. Which rectangle should go next in this sequence?
– E – C – B – F – D – A
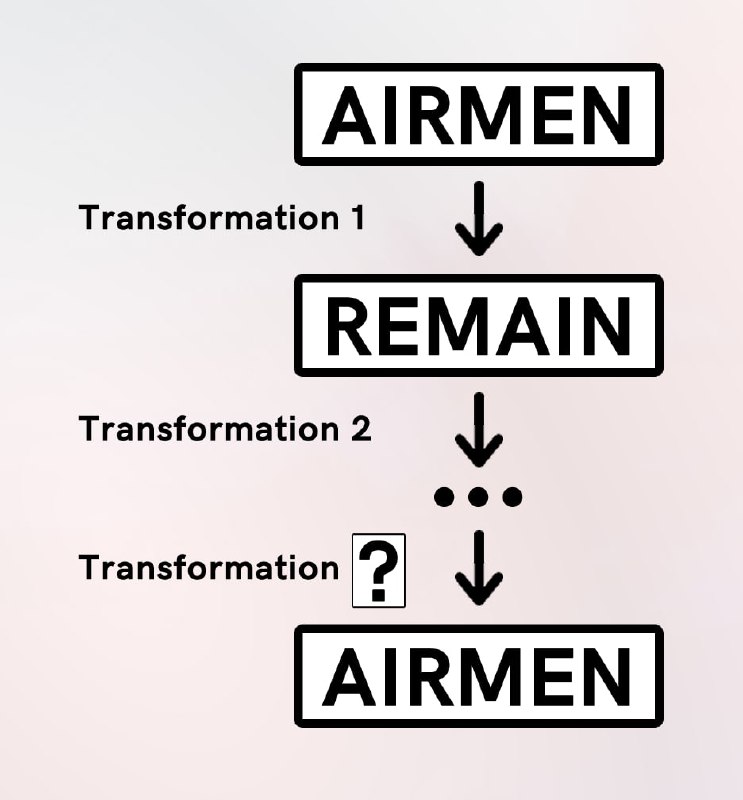
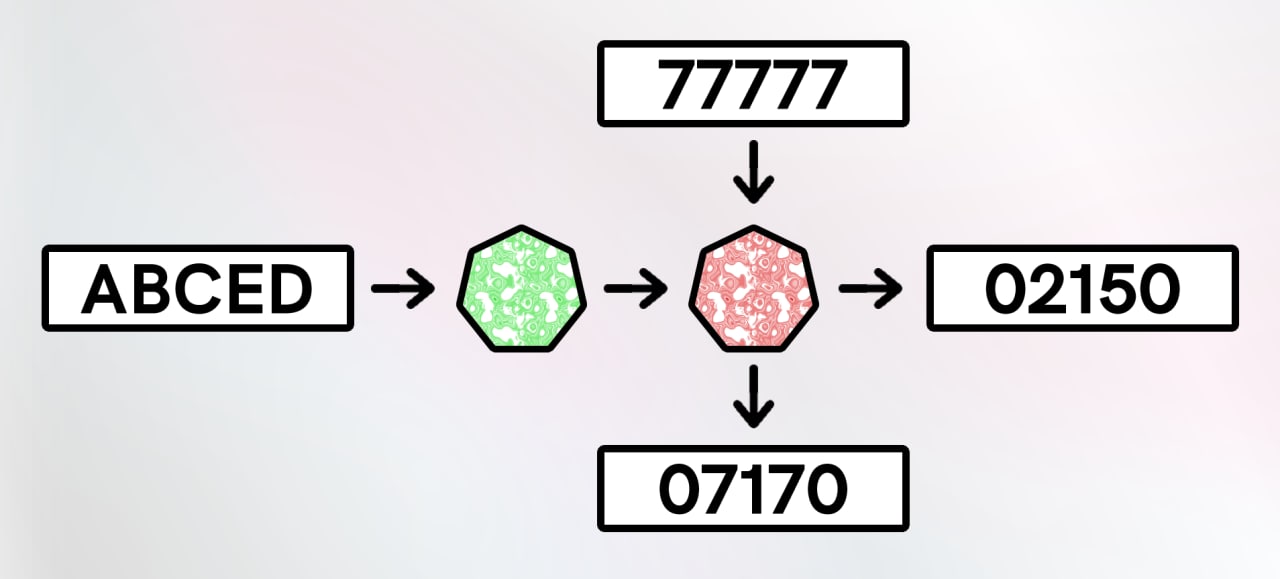
20. Given the above transformer, how many chained transformations are required in total to receive “AIRMEN” as a result from an initial input of “AIRMEN”?
– 4 – 3 – 10 – 6 – 9 – 2 – 8 – 7 – 11 – 5
21. A clock has two hands (hours and minutes). Currently, their position creates a 90° angle. From this point, how quickly can both hands point in approximately the same direction?
7. Nick spends 1/2 of his time working, 1/4 sleeping, 1/6 watching TV shows, 1/12 playing football. He spends the rest of the time studying. How many hours per day does Nick spend on studying?
10. 5 friends play a new rhythm game. At the end of the game, the average score obtained is 11. If one of the friends got a score of 19, what is the average score of the remaining 4 friends?
1 2 3 4 5 6 7 8
– 7 – 5 – 9 – 10 – 11 – 4 – 6 – 8
11. One half of one fifth of one eighth of an unknown number is 4. Which statement is true?
1 2 3 4 5 6
– The number is between 500 and 550 – The number is between 550 and 600 – The number is between 600 and 700 – The number is between 200 and 300 – The number is between 300 and 400 – The number is between 100 and 200
12. At Tom’s birthday there are 20 people: 15 boys and 5 girls. Among these, 14 have brown hair while 6 have blonde hair. What is the probability that there is a boy with blonde hair?
1
2
3
4
5
6
– 0.5 – 0.25 – 0.8 – 1 – 0.75 – 0.3
13. In a store, every time you buy 2 toys you receive a free book. Which function represents this relation between toys (x) and gifted books (y)?
1
2
3
4
– y = x – y = x +2 – y = 2x – y = x/2
14. There are 3 skyscrapers in a city, standing in a row one behind another. The first skyscraper is 120 m tall. Each of the skyscrapers are 50% taller than the one in front. How tall are all the skyscrapers, together?
1 2 3 4 5
– 270 m – 490 m – 570 m – 520 m – 360 m
15. After ordering the fractions in ascending order, which will be in the middle?
– A – B – D – E – C
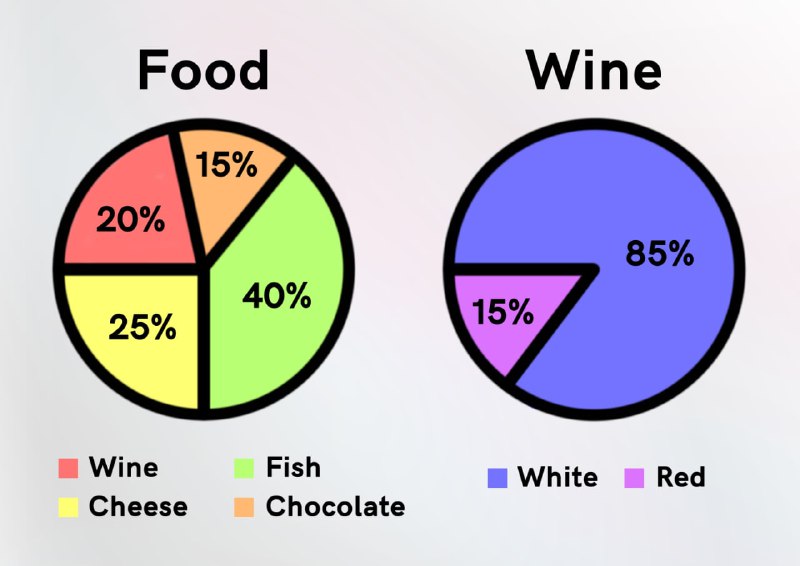
16. What percentage of food is red wine?
1 2 3 4 5 6 7 8
– 20% – 4% – 2% – 5% – 10% – 15% – 6% – 3%
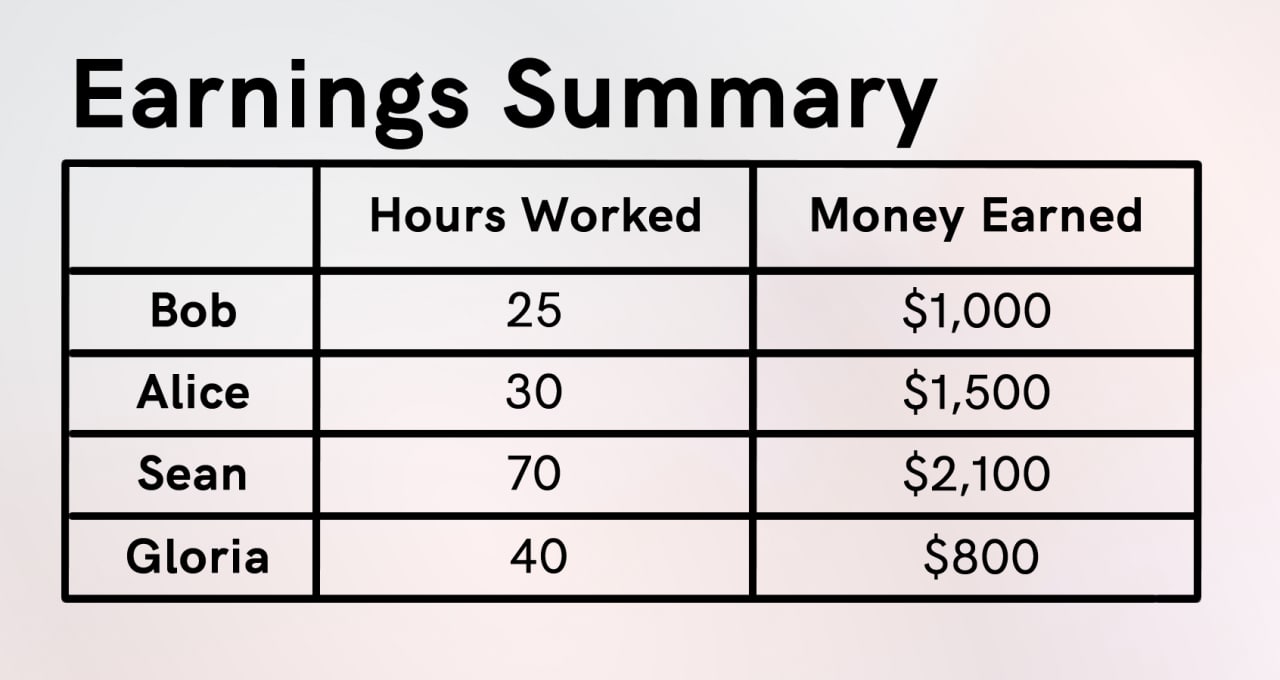
17. Who earns more money per hour?
– Bob – Gloria – Sean – Alice
18. Using the four pedestals, how many unique ways can the 4 cubes be ordered?
1 2 3 4 5 6
– 24 – 30 – 32 – 4 – 12 – 34
19. A set of numbers has an average of 5. What will the average be after adding 7 to every number?
1 2 3 4 5 6 7 8 9
– 10 – 35 – 20 – 25 – 5 – 12 – 18 – 7 – 15
20. Where “x” is whole number, which figure has an area that cannot be represented using the equation 2x+1?
1 2 3 4
– B – D – C – A
21. How many different colors are needed to ensure that each segment is not next to another of the same color?
1
2
3
4
5
– 6 – 4 – 2 – 3 – 5
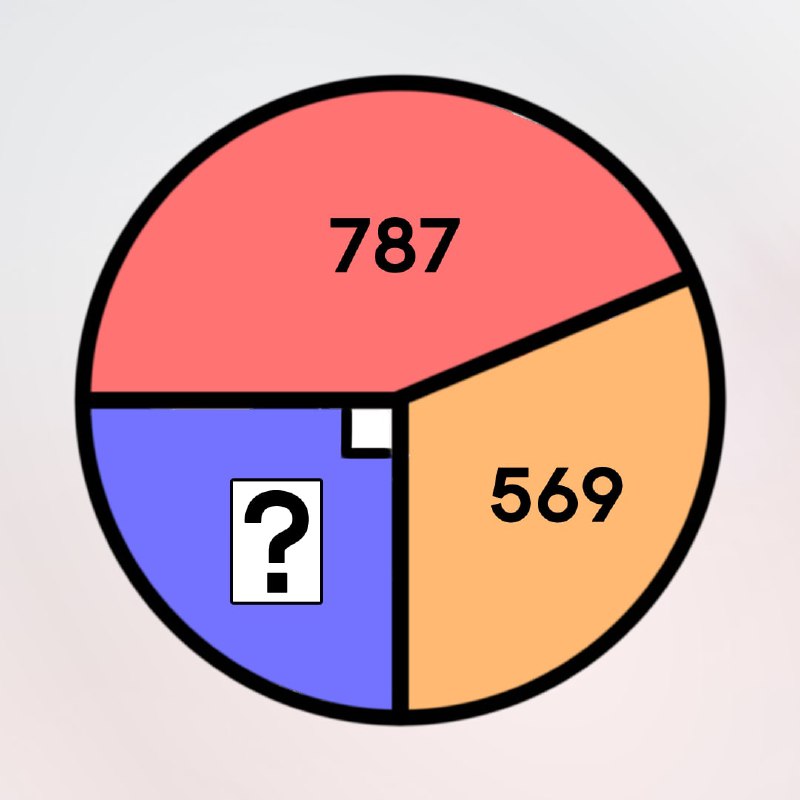
22. Solve the equation and find the value of X.
1
2
3
4
5
6
7
8
9
– X = 4 – X = 3.5 – X = 2 – X = 0.5 – X = 1 – X = 3 – X = 2.5 – X = 0 – X = 1.5
23. A bricklayer lays 3 bricks in 40 minutes. What is the maximum number of bricks he can lay in 6 hours?
1 2 3 4 5 6 7 8
– 23 – 25 – 27 – 20 – 9 – 36 – 15 – 10
24. Which of the following statements is correct?
1
2
3
4
5
6
– Diagram 4 displays different data than the rest. – Diagram 3 displays different data than the rest. – All diagrams display different data. – All diagrams display the same data. – Diagram 2 displays different data than the rest. – Diagram 1 displays different data than the rest.
25. Mike accidentally spilled ink on his result slip. If the average of all three subjects is 81 and he scored the lowest in chemistry, what is the lowest possible mark for biology?
1
2
3
4
5
6
7
8
9
10
– 78 – 79 – 72 – 76 – 75 – 77 – 73 – 74 – 71 – 70
26. Which is the largest number?
1
2
3
4
5
6
7
8
– E – D – A – F – B – G – C – H
27. A bottle, full of liquid A, weighs 2 kg. The same bottle, full of liquid B, weighs 1.75 kg. Knowing that liquid A is 25% heavier than liquid B, how much does the bottle weigh?
1 2 3 4 5
– 0.25 kg – 0.75 kg – 0.5 kg – 1 kg – 1.25 kg
28. Tom wants to add wallpaper to the walls in the bedroom, the living room, and the hallway. The wallpaper has no pattern and is 1 meter wide. How long should the wallpaper roll that Tom orders be?
You are receiving this message because you applied as a Telegram Translator.
1. Results and Next Stage
You participated in our aptitude tests in August and will receive your official results on Saturday, December 18 before 23:59 UTC. If your application is successful, we will invite you to complete a test task. We apologize for the long wait.
2. (Optional) Retry English Language Test
In case you are interested, you may take an additional English language test on Saturday, December 18. The test will start exactly at 14:00 UTC and will require approximately 30 minutes. We will consider the results of both tests – so you can use this as second opportunity.
We will send you more information about the test before it starts. You will need a computer with internet access (desktop or laptop preferred).
If you are interested in taking the extra English language test, please do this now:
Check your local time! (UTC time now) The task will open at 14:00 UTC on Saturday, December 18 and close at 14:30 UTC, you will not have time to complete it if you are late.
Log in to quiz.directory ahead of time (with the same account that got this message), to ensure you are able to start the task at exactly 14:00 UTC.
可能是之前提到过的”another opportunity”
2021-12-18 21:24,测试前的另一条消息
Additional English Language Test for Translator Candidates
As previously announced, we invite you to take the Additional English Language Test at 14:00 UTC today, in less than an hour.
English is the universal language of communication at Telegram. As a translator, it is vital for you to demonstrate exceptional English skills because translating interfaces and other texts requires a deep understanding of the finest details in the original, especially when it comes to manuals, blog posts, etc.
Please finish all the questions Some of the questions were intended to be difficult — and you are likely to make at least some mistakes. But don’t worry! The goal here is not to get 100% correct results, but rather to demonstrate how you solve progressively more difficult tasks under stress. We advise you to finish the test no matter what.
Important tips:
1. ONCE YOU CLICK ON AN ANSWER OPTION, YOU CAN’T CHANGE IT. The interface makes it look possible, but it’s not. Please click carefully.
2. Some questions will ask you to choose the (✅) CORRECT option, others — the (❌) WRONG option. Be careful to remember which one you are looking for!
3. We recommend you to log in to quiz.directory ahead of time to ensure you are able to start the test immediately when it opens. Use the same account that got this message to log in.
===
We will send another notification immediately before the test, but you are welcome to begin as soon as the test opens at 14:00 UTC.
1. What is the (✅) CORRECT ordering of the following six words: 'would', 'leaving', 'land', 'I', 'advise', 'the'?
– I would leaving the land advise. – I advise leaving the would land. – I advise the would land leaving. – I would advise leaving the land. – I would land the leaving advise. – I advise leaving the land would.
2. Select the (✅) CORRECT sentence.
– You can have 2 of bread. – You can have 2 bread. – You can have 2 slices of breads. – You can have 2 slices of bread.
3. What is the (✅) CORRECT ordering of the following five words: 'cold', 'everyone', 'being', 'too', 'hates'?
– Cold too hates everyone being. – Hates being everyone cold too. – Being too everyone hates cold. – Too being hates everyone cold. – Everyone hates being too cold.
4. Select the (❌) WRONG sentence.
– My mom's eighty, but she's still a young women at heart. – She dances very well, maybe she's a professional. – I'm afraid that I don't know him well. – Tim's away today, but he sends his regards. – Carl always found an excuse not to go. – I'm sorry, I don't feel well enough to play tennis today.
5. Select the (❌) WRONG sentence.
– Perhaps she would love me if I were taller. – He would buy a better house if he has more money. – I apologize if I was rude. – If she were at home, she would open the door.
6. Select the (✅) CORRECT sentence.
– That includes a x-ray scan. – Mark closes an once-in-a-lifetime deal. – Obviously, a eulogy is needed. – Thank you, this is a honor! – It was an yellow light.
7. Select the (❌) WRONG sentence.
– Never fly too close to the Sun. – 2 caves carved into the face of the mountain. – Well, the octopus was just annoying. – We live together in the harmony. – I could visit Japanese museums!
8. Read the following text: Wow, _____ has been a general improvement in the attitude of our students recently. _____ now paying attention, maybe it's as a result of _____ parents speaking to them?
Which option (✅) CORRECTLY fills the gaps?
– there, they're, their – their, there, they're – they're, there, their – they're, their, there – there, their, they're – their, they're, there
9. Select the (❌) WRONG sentence.
– Frankly, I'm surprised by this news. – It was shown in a completely different way by the media. – My secretary will send you the necessary informations. – The crime data was surprisingly bad, so I left the city. – I checked the train schedule, but it was too late. – Media can be powerful, especially when used correctly.
10. Select the (❌) WRONG sentence.
– The only lecture on Monday, which starts at 9:00 am, is "World History". – There are many lectures on Monday, but the only one that starts at 9:00 am, is "World History". – There are many lectures on Monday, but the only one, which starts at 9:00 am, is "World History". – The only lecture on Monday that starts at 9:00 am is "World History".
11. Read the following text: Her _____ are _____ big _____ fit.
Which option (✅) CORRECTLY fills the gaps?
– arm, to, too – arm, too, to – fit, too, to – feet, too, to – fit, to, too – feet, to, too
12. Read the following text: His shirt was still _____ _____, but he didn't _____ patience with the tailor, deciding to stay _____ instead.
– I already answered you about the question. – I already answered these questions for you. – I already answered you this question. – I already answered these question for you. – I already answered you this question, previously. – I already answered this questions to you. – I already answered this question to you.
14. Read the following text: This is one of the least maintained national parks! I didn't _____ that there _____ be such _____ views.
Which option (✅) CORRECTLY fills the gaps?
– thought, would, amazing – think, will, amazing – realize, would, great – think, will, great – think, would, a – realize, are, amazing – thought, will, great
15. Read the following text: Paul will be working at the factory _____ the river _____ the dense forest, _____ 8 am _____ 8 pm.
Which option (✅) CORRECTLY fills the gaps?
– from, and, from, to – between, to, between, and – between, to, from, to – between, and, from, between – from, to, from, to – from, between, from, to – from, to, from, and – between, and, from, to
16. Read the following text: To back out of certain modes — directions, for example — a user may have to tap four or five different areas and endure as many slow animations.
Select the (❌) WRONG interpretation.
– It takes too long to exit the "directions" mode. – Some actions require tapping in various places. – The speed of the animations is mentioned in a negative way. – It takes too long to exit the "directions" (as well as other) modes. – Too many taps are required to use the "directions" mode. – With 5 taps, 5 animations can be expected to play. – With 4 taps, 4 animations can be expected to play.
17. Select the (❌) WRONG sentence.
– I used the software to triangulate her position, I just wasn't possible to find her. – I can use this software to triangulate her position, or at least I think I can... – I wish I could use this software to triangulate her position, but I'm not allowed to. – Unfortunately, I wasn't able to use the software to triangulate her position. – I was told that I'd be able to use this software to triangulate her position, but I wasn't able to. – Supposedly, I can use this software to triangulate her position. Let's see...
18. Read the following text: Knowledge is a thing that one cannot have enough of. It is the fruit of wisdom, to be eaten carefully and digested fully.
Select the (✅) CORRECT interpretation.
– Knowledge is always good and cannot be gained in a sub-optimal way. – Having lots of knowledge is good, but it should be completely understood and thoughtfully learned. – Improving your knowledge is healthy, like eating fruit for improved digestion. – You should only seek out new knowledge when you're hungry. – Wisdom is improved by having as much knowledge as possible, even if you don't fully understand it.
19. Read the following text:
It is commonly said, even by the English themselves, that English cooking is the worst in the world. It is supposed to be not merely incompetent, but also imitative, and I even read quite recently, in a book by a French writer, the remark: 'The best English cooking is, of course, simply French cooking.'
Now that is simply not true, as anyone who has lived long abroad will know, there is a whole host of delicacies which it is quite impossible to obtain outside the English-speaking countries.
Select the (❌) WRONG interpretation.
– The author feels that those who have lived abroad for a long time should understand his viewpoint. – The author believes that the "best English cooking", is in fact French. – There is a lot of great food that cannot be found in foreign countries. – The author does not believe that English cooking is the worst in the world. – English people often criticize their own country's cooking.
20. Read the following text:
It will be seen that we have no cause to be ashamed of our cookery, so far as originality goes or so far as the ingredients go. And yet it must be admitted that there is a serious snag from the foreign visitor's point of view. This is, that you practically don’t find good English cooking outside a private house. If you want, say, a good, rich slice of Yorkshire pudding you are more likely to get it in the poorest English home than in a restaurant, which is where the visitor necessarily eats most of his meals.
Select the (✅) CORRECT interpretation.
– Visitors may not get a true taste of English cookery from restaurants, as opposed to private houses. – English cooking in restaurants is bound to be better than cooking found in the homes of the poor. – It is wrong to be ashamed of English cookery, but the originality and ingredients could be improved. – A visitor would change their mind about English cooking after tasting a Yorkshire pudding.
21. Read the following conversation:
Tim: Hey! Can you make a three-tier cake before 6 pm?
Andy: Maybe. It depends on which flavor you want.
Tim: The flavor can be chocolate, red velvet, or even plain vanilla. The more important thing is that it must not contain nuts.
Andy: Perfect, we already have some cakes with those flavors and without any nuts.
Tim: So, will you have it ready by 6 pm?
Andy: I think so... But if we reduce the number of tiers by one, I can guarantee that it'll be ready.
Tim: Okay. Let's do that then, but please make sure to add lots of decorations.
Andy: Sure, see you later!
Which kind of cake was ordered?
– A three-tier cake, with plain vanilla flavoring and decorations. – A three-tier cake, with chocolate, red velvet, or plain vanilla flavoring and decorations. – A two-tier cake, with chocolate, red velvet, or plain vanilla flavoring and decorations. – A two-tier cake, with red velvet, or plain vanilla flavoring and decorations. – A two-tier cake, with chocolate, red velvet, or plain vanilla flavoring and no decorations. – A two-tier cake, with chocolate, or plain vanilla flavoring and no decorations. – A three-tier cake, with plain vanilla flavoring and no decorations. – A three-tier cake, with chocolate, red velvet, or plain vanilla flavoring and no decorations.
22. Read the following conversation: (Note: unchanged from previous question)
Tim: Hey! Can you make a three-tier cake before 6 pm?
Andy: Maybe. It depends on which flavor you want.
Tim: The flavor can be chocolate, red velvet, or even plain vanilla. The more important thing is that it must not contain nuts.
Andy: Perfect, we already have some cakes with those flavors and without any nuts.
Tim: So, will you have it ready by 6 pm?
Andy: I think so... But if we reduce the number of tiers by one, I can guarantee that it'll be ready.
Tim: Okay. Let's do that then, but please make sure to add lots of decorations.
Andy: Sure, see you later!
From the text, it is possible to reasonably infer which of these assumptions?
– Tim thinks that someone who dislikes or is allergic to banana will eat some cake. – Andy is making the cake for himself. – Andy is lying when he suggests a three-tier cake will be harder to make. – Tim thinks that someone who dislikes or is allergic to nuts will eat some cake. – Andy is making the cake for a birthday party which starts at 6 pm. – Andy is making the cake for a birthday party. – Andy does not enjoy making cakes anymore. – The cake will be chocolate flavored. – The cake will be plain vanilla flavored.
23. Read the following text:
The current generation of rovers, Curiosity and Perseverance, run on nuclear power and have more backup parts. That's largely because Opportunity and Spirit proved that we could operate for far longer than 90 days, empowering mission designers to start planning expeditions that last for years.
Select the (❌) WRONG interpretation.
– Curiosity and Perseverance run by using nuclear energy. – Thanks to the success of previous rovers, mission designers began to plan much longer expeditions. – Curiosity and Perseverance are able to be more reliable, as more backup parts are available to them. – Spirit wasn't able to operate for more than 90 days.
24. Read the following text:
Due to complaints from worried parents during the previous semester, we investigated students' internet usage during school hours. Our biggest concern was the use of social media during class. Therefore, as agreed with members of the parents' association, we have decided to only give out the Wi-Fi password to final-year students. For all other students, the school computers will be available for use during break-times. If we do not see an improvement from these measures, we will consider further action.
Select the (✅) CORRECT interpretation.
– All of the parents were asked for their opinion before this new policy was put in place. – If the situation does not improve, the policy will be reversed. – The parents complained during the final trimester of the school year. – Students who are not in their final year will not have access to the Wi-Fi password. – Students were using their phones to play games during class.
25. Read the following text:
Emma has flowing, curly red hair which reaches her hips, whereas Kate's is black and only reaches her shoulders.
Select the (✅) CORRECT sentence.
– Kate's hair is longest than Emma's. – Emma's hair is shortest than Kate's. – Emma's hair is longer than Kate's. – Kate's hair is shortest than Emma's. – Emma's hair is taller than Kate's. – Kate's hair is smaller than Emma's.
26. Read the following text:
Even if precautions are taken, the average person can expect one or two colds a year.
While most precautions are common sense, such as frequently washing your hands, others, like getting plenty of sleep, can be unexpectedly beneficial.
Select the (✅) CORRECT interpretation.
– An average person with common sense can prevent colds. – People with a cold must use their common sense to prevent it. – There is no guaranteed way to prevent colds. – Adequate precautions lead to better common sense. – Getting plenty of sleep is more effective than washing your hands. – It's common sense that washing your hands helps more than getting plenty of sleep.
27. Read the following text:
[1] Smiling is fascinating, because humans don't have to learn how to do it. [2] It is an imitative behavior. [3] Although babies imitate different facial expressions that they see, they start smiling and smirking from the moment they are born. [4] So, we can infer that smiling isn't learned through imitation. [5] Until recently, this behavior of newborns was incorrectly considered to be imitative.
Which of the sentences contradicts ALL of the others?
Did you cleared the history through the Android app? If so, there is a known issue where the history will only be cleared for you, and not also for your chat partner.
The text is (❌) WRONG in which places?
– "not also for your" – "not also for your" and "will only be" – There are no errors. – "Did you cleared" and "will only be" – "not also for your" and "Did you cleared" – "Did you cleared" – "Did you cleared" and "your chat partner"
29. Read the following text:
There are many people here without any technical backgrounds, who will have some trouble understanding why encryption is even important. Or worse, will have a negative preconception of "encryption" due to there local press. It's therefore important to tread carefully here.
The text is (❌) WRONG in which places?
– "understanding why encryption" and "local press" – "understanding why encryption" and "negative preconception" and "to there" – "to tread" and "understanding why encryption" – "without any technical backgrounds" and "understanding why encryption" – "understanding why encryption" and "negative preconception" – "without any technical backgrounds" and "to there" – "understanding why encryption" and "local press" and "to there" – "without any technical backgrounds"
30. Read the following text:
A computer analyzes images to determine if they are tampered or untampered. A percentage value is output for each analyzed image. The higher the percentage, the greater the chance of the image being edited.
After analyzing a set of images, this percentage was most commonly between 13% and 77%.
Surprisingly, values below 5% and above 95% were also output frequently, which likely indicates a flaw in the algorithm used for the analysis.
Select the (❌) WRONG interpretation.
– A value of 100% was not the most commonly received. – Values above 95% were expected to be the most frequent. – Generally, images that produce low values should be more likely to be untampered. – The analysis returned unexpected results that should not have been possible. – The percentage value indicates the likelihood of the image being edited.
最后阶段
2021-12-29 07:18 收到通知
You are receiving this message because you applied as a Telegram Translator — and performed better than thousands of other applicants in our quizzes.
Congratulations and sorry for the long wait! We now invite you to participate in the final stage of the Translator Tryouts.
It is a set of four tasks that need to be completed before 23:59 UTC on Wednesday, December 22.
CHOOSING YOUR LANGUAGE You will be able to submit the task for more than one language if you want. We suggest that you only choose those languages that you know really well.
SUBMISSION You will submit the tasks to this bot as:
One Telegra.ph page (Tasks 1 and 2)
One message with a list of links (Task 3)
And one photo (Task 4)
The bot will message you again when it’s ready to accept submissions, this will happen closer to the deadline.
EVALUATION Evaluating all submissions will require a significant amount of time, however we expect to finish the process within a couple of months. It is likely that translators for widely spoken languages will get their results earlier.
NOTE We expect translators to be discreet. We understand you may want to share this task with friends, but please don’t discuss it with anyone else. Dealing with Telegram’s update texts would require similar restraint in the future. 😉
Would you like to proceed? Please use the buttons below to tell us whether or not you will be participating in the final stage.