OS:CentOS/Debian
参考:https://geekflare.com/open-source-web-application-firewall/
开源的软waf通常有以下5种:
- ModSecurity
- IronBee
- NAXSI
- WebKnight
- Shadow Daemon
这里我们采用Naxsi+Nginx来构建,并尝试使用kibana做waf日志的可视化。
目前好像就freebuf上有一篇和这个差不多的文章:http://www.freebuf.com/articles/web/170781.html
从截图可以看出是使用的nginx+naxsi,可视化平台是kibana,但是没讲安装配置的详情,我就作一个尝试,并记录下来。
Naxsi简介
Naxsi是一个开放源代码、高效、低维护规则的Nginx web,应用防火墙模块,主要目标是帮助人们加固他们的web应用程序,以抵御sql注入、跨站脚本(XSS)、跨域伪造请求(CSRF)、本地(LFI)和远程文件包含(RFI)漏洞。
Naxsi开源地址: https://github.com/nbs-system/naxsi
Naxsi-rules开源地址: https://github.com/nbs-system/naxsi-rules
安装参考naxsi项目中wiki的naxsi-compile一节:
https://github.com/nbs-system/naxsi/wiki/naxsi-compile
安装Nginx+Naxsi
一些必要依赖
CentOS:1
2yum install -y epel-release
yum install -y gcc-c++ pcre pcre-devel zlib zlib-devel openssl openssl-devel libxml2 libxml2-devel
下载nginx
nginx目前的stable版本 1.14.01
wget http://nginx.org/download/nginx-1.14.0.tar.gz
下载naxsi
naxsi 0.55.31
wget https://github.com/nbs-system/naxsi/archive/0.55.3.tar.gz
解压
1 | tar xvzf nginx-1.14.0.tar.gz |
查看其他机器上已经安装的nginx的编译参数
1 | [root@test ~]# nginx -V |
编译nginx
进入目录1
cd nginx-1.14.0
开始编译1
2
3
4
5
6
7
8
9
10
11
12
13
14
15
16
17
18
19
20
21
22
23
24./configure --conf-path=/etc/nginx/nginx.conf \
--add-module=../naxsi-0.55.3/naxsi_src/ \
--error-log-path=/var/log/nginx/error.log \
--http-client-body-temp-path=/usr/local/nginx/body \
--http-fastcgi-temp-path=/usr/local/nginx/fastcgi \
--http-uwsgi-temp-path=/usr/local/nginx/uwsgi \
--http-scgi-temp-path=/usr/local/nginx/scgi \
--http-log-path=/var/log/nginx/access.log \
--http-proxy-temp-path=/usr/local/nginx/proxy \
--lock-path=/var/run/nginx.lock \
--pid-path=/var/run/nginx.pid \
--with-http_ssl_module \
--with-ld-opt="-ljemalloc" \
--with-http_addition_module \
--with-http_realip_module \
--with-http_gunzip_module \
--without-mail_pop3_module \
--without-mail_smtp_module \
--without-mail_imap_module \
--without-http_uwsgi_module \
--without-http_scgi_module \
--with-ipv6 \
--sbin-path=/usr/sbin/nginx \
--prefix=/usr/share/nginx
报错1
2
3
4
5
6
7
8checking for OS
+ Linux 3.10.0-693.el7.x86_64 x86_64
checking for C compiler ... found
+ using GNU C compiler
+ gcc version: 4.8.5 20150623 (Red Hat 4.8.5-16) (GCC)
checking for gcc -pipe switch ... found
checking for --with-ld-opt="-ljemalloc" ... not found
./configure: error: the invalid value in --with-ld-opt="-ljemalloc"
没有jemalloc
参考:https://my.oschina.net/manmao/blog/603881
jemalloc是一个进行内存管理优化的软件,nginx使用了jemalloc编译的话,运行会很快。
安装jemalloc
选择版本
https://src.fedoraproject.org/lookaside/pkgs/jemalloc/
我们下载3.4.01
2
3
4
5
6
7
8cd /opt
wget https://src.fedoraproject.org/lookaside/pkgs/jemalloc/jemalloc-3.4.0.tar.bz2/c4fa3da0096d5280924a5f7ebc8dbb1c/jemalloc-3.4.0.tar.bz2
tar xjf jemalloc-3.4.0.tar.bz2
cd jemalloc-3.4.0
./configure
make && make install
echo '/usr/local/lib' > /etc/ld.so.conf.d/local.conf
ldconfig
tar xjf jemalloc-3.4.0.tar.bz2
解压的时候如果报错如下1
2
3
4
5[root@localhost opt]# tar xjf jemalloc-4.2.1.tar.bz2
tar (child): bzip2: Cannot exec: No such file or directory
tar (child): Error is not recoverable: exiting now
tar: Child returned status 2
tar: Error is not recoverable: exiting now
这是因为没有bzip21
yum install -y bzip2
安装好了bzip2后再次解压即可
再次编译nginx
1 |
|
安装
1 | make && make install |
启动nginx
1 | [root@localhost nginx-1.14.0]# nginx |
没有这个目录 /usr/local/nginx/body
递归创建即可1
mkdir -p /usr/local/nginx/body
再次启动,没有报错,编译成功。
Naxsi的基本配置
参考:https://github.com/nbs-system/naxsi/wiki/naxsi-setup
首先将 naxsi 目录下的 naxsi_core.rules 拷贝至 nginx.conf 所在目录。1
cp /opt/naxsi-0.55.3/naxsi_config/naxsi_core.rules /etc/nginx/
修改nginx配置文件
1 | vim /etc/nginx/nginx.conf |
http部分配置
在http{}导入naxsi规则1
2
3http {
include naxsi_core.rules;
}
server部分配置
1 | location / { |
location部分配置
location /RequestDenied
返回HTTP错误代码,其他的处理等
完整配置如下
1 | server { |
保存后,再重新加载nginx1
2nginx -t
nginx -s reload
验证waf生效
用curl请求’http://127.0.0.1/?a=<>’, 你会在naxsi.log中看到NAXSI_FMT字样,比如:
curl http://127.0.0.1/?a=<>1
2016/07/12 13:27:04 [error] 14492#0: *1 NAXSI_FMT: ip=127.0.0.1&server=127.0.0.1&uri=/&learning=1&vers=0.55rc2&total_processed=1&total_blocked=1&block=1&cscore0=$XSS&score0=16&zone0=ARGS&id0=1302&var_name0=a&zone1=ARGS&id1=1303&var_name1=a, client: 127.0.0.1, server: localhost, request: "GET /?a=<> HTTP/1.1", host: "127.0.0.1"
学习模式, 插入日志到ElasticSearch/Kibana
确保以下项目已经完成:
- 一个nginx
- 已经安装Naxsi,并且运行在学习模式
- 用curl请求’http://127.0.0.1:4242/?a=<>’, 你会在log中看到
NAXSI_FMT字样,比如:
1 | 2016/07/12 13:27:04 [error] 14492#0: *1 NAXSI_FMT: ip=127.0.0.1&server=127.0.0.1&uri=/&learning=1&vers=0.55rc2&total_processed=1&total_blocked=1&block=1&cscore0=$XSS&score0=16&zone0=ARGS&id0=1302&var_name0=a&zone1=ARGS&id1=1303&var_name1=a, client: 127.0.0.1, server: localhost, request: "GET /?a=<> HTTP/1.1", host: "127.0.0.1:4242" |
ElasticSearch/Kibana部分是可选的,安装后,能够通过分析日志,展示发生了哪些请求。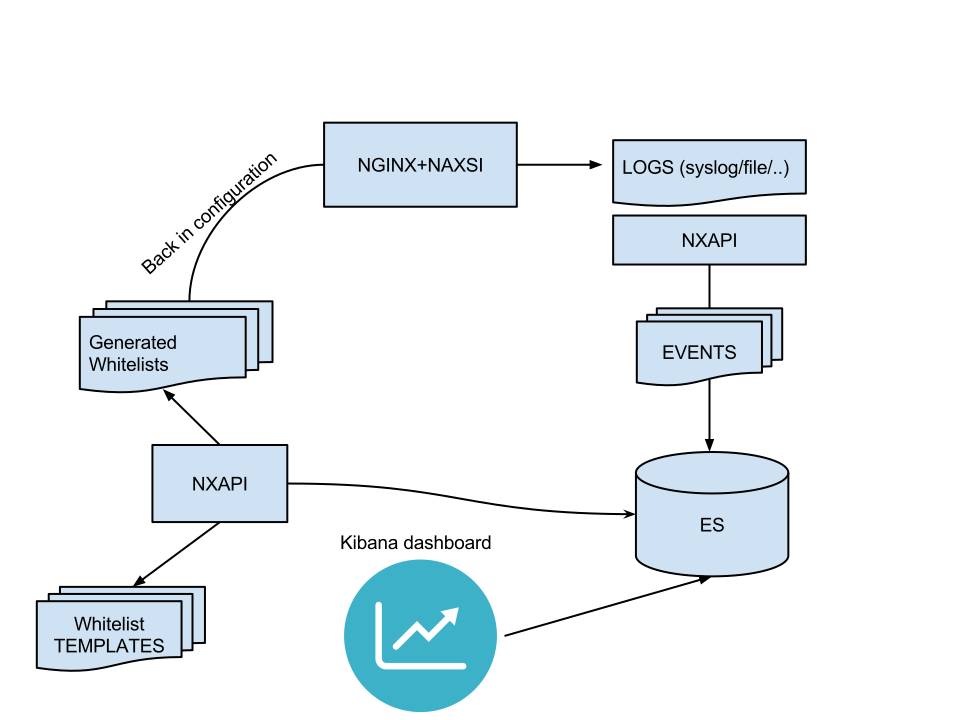
组件
Nxtool 在这设置: (一句话安装: python setup.py install, or ./nxtool.py -c nxapi.json -x)
nxapi
其实就是这个目录1
2cd /opt/naxsi-0.55.3/nxapi/
python setup.py install
我试试运行./nxtool.py -c nxapi.json -x,提示ImportError: No module named elasticsearch
kibana
Kibana 在这里下载:
因为kibana和ElasticSearch的版本要一致才能工作,ElasticSearch我们下载5.6.9,所以kibana也下载这个版本
在历史版本页面选择kibana的5.6.9版本
CentOS
1 | wget https://artifacts.elastic.co/downloads/kibana/kibana-5.6.9-x86_64.rpm |
Debian
1 | wget https://artifacts.elastic.co/downloads/kibana/kibana-5.6.9-amd64.deb |
修改kibana配置
vim /etc/kibana/kibana.yml1
2
3
4
5
6
7
8
9
10
11
12[root@localhost ~]# cat /etc/kibana/kibana.yml
server.port: 5601
server.host: "0.0.0.0"
server.basePath: ""
server.maxPayloadBytes: 1048576
server.name: "your-hostname"
elasticsearch.url: "http://localhost:9200"
elasticsearch.preserveHost: true
kibana.index: ".kibana"
kibana.defaultAppId: "home"
elasticsearch.username: "user"
elasticsearch.password: "pass"
启动kibana
1 | service kibana start |
然后可以在浏览器用http://
ElasticSearch
kibana依赖于ElasticSearch
虽然wiki中好像没有讲要安装ES,但是后面会把nginx的日志插入到ES中,所以必须要安装ES
参考:
https://www.elastic.co/guide/en/elasticsearch/reference/current/index.html
https://www.biaodianfu.com/centos-7-install-elasticsearch.html
这里有个坑,nxapi只支持ElasticSearch的1/2/5版本
安装ElasticSearch
5版本中最新的是5.6.9
在历史版本页面选择ElasticSearch的5.6.9版本
CentOs
1 | wget https://artifacts.elastic.co/downloads/elasticsearch/elasticsearch-5.6.9.rpm |
rpm安装的时候会有如下输出1
2
3
4
5
6
7
8
9
10Preparing... ################################# [100%]
Creating elasticsearch group... OK
Creating elasticsearch user... OK
Updating / installing...
1:elasticsearch-0:6.2.4-1 ################################# [100%]
### NOT starting on installation, please execute the following statements to configure elasticsearch service to start automatically using systemd
sudo systemctl daemon-reload
sudo systemctl enable elasticsearch.service
### You can start elasticsearch service by executing
sudo systemctl start elasticsearch.service
安装完成后并没有启动ElasticSearch
按照提示运行以下命令,添加ElasticSearch到系统服务:1
2sudo systemctl daemon-reload
sudo systemctl enable elasticsearch.service
启动ElasticSearch服务1
sudo systemctl start elasticsearch.service
但是我们还没有修改配置,等会儿再启动
Debian
1 | wget https://artifacts.elastic.co/downloads/elasticsearch/elasticsearch-5.6.9.deb |
安装完不会自动启动
修改配置
反注释掉几项配置,并修改path.data和path.logs的值:
vim /etc/elasticsearch/elasticsearch.yml1
2
3
4
5
6
7cluster.name: my-application
node.name: node-1
node.attr.rack: r1
path.data: /var/lib/elasticsearch
path.logs: /var/log/elasticsearch
network.host: 0.0.0.0
http.port: 9200
这条保持注释状态:1
#bootstrap.memory_lock: true
JDK环境
我的CentOS/Debian是最小化安装,官方建议使用oracle的java
如果你的系统中已经有了openjdk,建议卸载掉,安装oracle的java
CentOS:
搜索openjdk1
rpm -qa | grep openjdk
如果有1
rpm -e <package name>
跟上包名删掉
Debian:1
root@debian:/opt# dpkg -l | grep openjdk
如果有,apt卸载并删除相关配置文件1
apt purge <package name>
或者dpkg卸载并删除相关配置文件1
dpkg --purge <package name>
安装JDK
jdk1.8下载地址:http://www.oracle.com/technetwork/java/javase/downloads/jdk8-downloads-2133151.html
命令行下载有个麻烦的地方,就是需要同意oracle的许可协议,我以前都是电脑上先抓包下载连接
直到看到参考2安装指南,可以用cookie解决,这种姿势比较优雅。
浏览器先点同意许可,然后复制对应链接,再在wget的时候加上header即可。
CentOS:1
2
3
4
5cd /opt/
wget --no-check-certificate --no-cookies \
--header "Cookie: oraclelicense=accept-securebackup-cookie" \
http://download.oracle.com/otn-pub/java/jdk/8u172-b11/a58eab1ec242421181065cdc37240b08/jdk-8u172-linux-x64.rpm
rpm -ivh jdk-8u172-linux-x64.rpm
Debian:1
2
3
4
5cd /opt/
wget --no-check-certificate --no-cookies \
--header "Cookie: oraclelicense=accept-securebackup-cookie" \
http://download.oracle.com/otn-pub/java/jdk/8u172-b11/a58eab1ec242421181065cdc37240b08/jdk-8u172-linux-x64.tar.gz
tar zxvf jdk-8u172-linux-x64.tar.gz
添加JAVA环境变量
CentOS:
java安装目录1
2find / -name jdk
/usr/java/jdk1.8.0_172
编辑系统环境变量文件1
vim /etc/profile
添加1
2
3
4export JAVA_HOME=/usr/java/jdk1.8.0_172
export JRE_HOME=${JAVA_HOME}/jre
export CLASSPATH=.:${JAVA_HOME}/lib:${JRE_HOME}/lib
export PATH=${JAVA_HOME}/bin:${PATH}
加载环境变量1
source /etc/profile
Debian
java目录:/opt/jdk1.8.0_172/
编辑系统环境变量文件1
vim /etc/profile
添加1
2
3
4export JAVA_HOME=/opt/jdk1.8.0_172
export JRE_HOME=${JAVA_HOME}/jre
export CLASSPATH=.:${JAVA_HOME}/lib:${JRE_HOME}/lib
export PATH=${JAVA_HOME}/bin:${PATH}
加载环境变量1
source /etc/profile
验证是否安装成功
java -version1
2
3
4root@debian:/opt# java -version
java version "1.8.0_172"
Java(TM) SE Runtime Environment (build 1.8.0_172-b11)
Java HotSpot(TM) 64-Bit Server VM (build 25.172-b11, mixed mode)
启动ElasticSearch
如果是debian的话,按照我上面的方式设置环境变量,ES可能会找不到java的二进制执行文件,比如运行service elasticsearch restart后,查看状态service elasticsearch status可能会failed,报错:1
May 16 16:13:15 debian elasticsearch[19931]: Could not find any executable java binary. Please install java in your PATH or se...A_HOME
设置一个软连接1
ln -s /opt/jdk1.8.0_172/bin/java /usr/bin/java
再次启动1
service elasticsearch restart
查看状态,显示在running,并且日志目录有log文件1
2ls /var/log/elasticsearch/
my-application_deprecation.log my-application_index_indexing_slowlog.log my-application_index_search_slowlog.log my-application.log
此时在本机用浏览器访问http://ip:9200, 或者服务器上curl http://localhost:9200应该会返回json。1
2
3
4
5
6
7
8
9
10
11
12
13
14# curl http://localhost:9200
{
"name" : "node-1",
"cluster_name" : "my-application",
"cluster_uuid" : "ad2Qn8AxQ7-PO34ySoYM8Q",
"version" : {
"number" : "5.6.9",
"build_hash" : "877a590",
"build_date" : "2018-04-12T16:25:14.838Z",
"build_snapshot" : false,
"lucene_version" : "6.6.1"
},
"tagline" : "You Know, for Search"
}
======
如果在上面,注释了这条:1
bootstrap.memory_lock: true
就会报错。。
排错如下:
查看状态1
2
3
4
5
6
7
8
9
10
11
12
13
14[root@localhost ~]# service elasticsearch status
● elasticsearch.service - Elasticsearch
Loaded: loaded (/usr/lib/systemd/system/elasticsearch.service; enabled; vendor preset: disabled)
Active: failed (Result: exit-code) since Sat 2018-05-12 15:51:53 CST; 24min ago
Docs: http://www.elastic.co
Process: 17596 ExecStart=/usr/share/elasticsearch/bin/elasticsearch -p ${PID_DIR}/elasticsearch.pid --quiet (code=exited, status=78)
Main PID: 17596 (code=exited, status=78)
May 12 15:51:18 localhost.localdomain systemd[1]: Started Elasticsearch.
May 12 15:51:18 localhost.localdomain systemd[1]: Starting Elasticsearch...
May 12 15:51:53 localhost.localdomain systemd[1]: elasticsearch.service: main...
May 12 15:51:53 localhost.localdomain systemd[1]: Unit elasticsearch.service ...
May 12 15:51:53 localhost.localdomain systemd[1]: elasticsearch.service failed.
Hint: Some lines were ellipsized, use -l to show in full.
运行1
2[root@localhost ~]# service elasticsearch start
Starting elasticsearch (via systemctl): [ OK ]
查看状态,惊人的在运行1
2
3
4
5
6
7
8[root@localhost ~]# service elasticsearch status
● elasticsearch.service - Elasticsearch
Loaded: loaded (/usr/lib/systemd/system/elasticsearch.service; enabled; vendor preset: disabled)
Active: active (running) since Sat 2018-05-12 16:16:44 CST; 9s ago
Docs: http://www.elastic.co
Main PID: 18144 (java)
CGroup: /system.slice/elasticsearch.service
└─18144 /bin/java -Xms1g -Xmx1g -XX:+UseConcMarkSweepGC -XX:CMSInitiatingOccupancyFraction=75 -XX:+UseCMSInitiatingOccupa...
但是过一会儿failed了。
看日志,有5个文件1
2
3[root@localhost ~]# cat /var/log/elasticsearch/
gc.log.0.current my-application_index_indexing_slowlog.log my-application.log
my-application_deprecation.log my-application_index_search_slowlog.log
随便看个my-application.log的吧1
2
3
4
5
6
7
8
9
10
11
12
13
14
15
16
17
18
19
20
21
22
23
24
25
26
27
28
29
30
31
32
33
34
35
36
37
38
39
40
41
42
43
44
45
46
47
48
49
50
51
52
53
54
55
56
57
58
59
60
61
62
63
64
65
66
67
68
69
70
71
72
73
74
75
76
77
78
79
80
81
82
83[root@localhost ~]# cat /var/log/elasticsearch/my-application.log
[2018-05-12T15:51:36,524][WARN ][o.e.b.JNANatives ] Unable to lock JVM Memory: error=12, reason=Cannot allocate memory
[2018-05-12T15:51:36,533][WARN ][o.e.b.JNANatives ] This can result in part of the JVM being swapped out.
[2018-05-12T15:51:36,534][WARN ][o.e.b.JNANatives ] Increase RLIMIT_MEMLOCK, soft limit: 65536, hard limit: 65536
[2018-05-12T15:51:36,534][WARN ][o.e.b.JNANatives ] These can be adjusted by modifying /etc/security/limits.conf, for example:
# allow user 'elasticsearch' mlockall
elasticsearch soft memlock unlimited
elasticsearch hard memlock unlimited
[2018-05-12T15:51:36,534][WARN ][o.e.b.JNANatives ] If you are logged in interactively, you will have to re-login for the new limits to take effect.
[2018-05-12T15:51:38,388][INFO ][o.e.n.Node ] [node-1] initializing ...
[2018-05-12T15:51:38,919][INFO ][o.e.e.NodeEnvironment ] [node-1] using [1] data paths, mounts [[/ (rootfs)]], net usable_space [44.5gb], net total_space [46.9gb], types [rootfs]
[2018-05-12T15:51:38,919][INFO ][o.e.e.NodeEnvironment ] [node-1] heap size [1007.3mb], compressed ordinary object pointers [true]
[2018-05-12T15:51:38,921][INFO ][o.e.n.Node ] [node-1] node name [node-1], node ID [oQd6nyQKT_2FJNJpG0-vqA]
[2018-05-12T15:51:38,921][INFO ][o.e.n.Node ] [node-1] version[6.2.4], pid[17596], build[ccec39f/2018-04-12T20:37:28.497551Z], OS[Linux/3.10.0-693.el7.x86_64/amd64], JVM[Oracle Corporation/Java HotSpot(TM) 64-Bit Server VM/1.8.0_162/25.162-b12]
[2018-05-12T15:51:38,921][INFO ][o.e.n.Node ] [node-1] JVM arguments [-Xms1g, -Xmx1g, -XX:+UseConcMarkSweepGC, -XX:CMSInitiatingOccupancyFraction=75, -XX:+UseCMSInitiatingOccupancyOnly, -XX:+AlwaysPreTouch, -Xss1m, -Djava.awt.headless=true, -Dfile.encoding=UTF-8, -Djna.nosys=true, -XX:-OmitStackTraceInFastThrow, -Dio.netty.noUnsafe=true, -Dio.netty.noKeySetOptimization=true, -Dio.netty.recycler.maxCapacityPerThread=0, -Dlog4j.shutdownHookEnabled=false, -Dlog4j2.disable.jmx=true, -Djava.io.tmpdir=/tmp/elasticsearch.OKdyF3bw, -XX:+HeapDumpOnOutOfMemoryError, -XX:HeapDumpPath=/var/lib/elasticsearch, -XX:+PrintGCDetails, -XX:+PrintGCDateStamps, -XX:+PrintTenuringDistribution, -XX:+PrintGCApplicationStoppedTime, -Xloggc:/var/log/elasticsearch/gc.log, -XX:+UseGCLogFileRotation, -XX:NumberOfGCLogFiles=32, -XX:GCLogFileSize=64m, -Des.path.home=/usr/share/elasticsearch, -Des.path.conf=/etc/elasticsearch]
[2018-05-12T15:51:44,761][INFO ][o.e.p.PluginsService ] [node-1] loaded module [aggs-matrix-stats]
[2018-05-12T15:51:44,773][INFO ][o.e.p.PluginsService ] [node-1] loaded module [analysis-common]
[2018-05-12T15:51:44,773][INFO ][o.e.p.PluginsService ] [node-1] loaded module [ingest-common]
[2018-05-12T15:51:44,773][INFO ][o.e.p.PluginsService ] [node-1] loaded module [lang-expression]
[2018-05-12T15:51:44,773][INFO ][o.e.p.PluginsService ] [node-1] loaded module [lang-mustache]
[2018-05-12T15:51:44,774][INFO ][o.e.p.PluginsService ] [node-1] loaded module [lang-painless]
[2018-05-12T15:51:44,774][INFO ][o.e.p.PluginsService ] [node-1] loaded module [mapper-extras]
[2018-05-12T15:51:44,774][INFO ][o.e.p.PluginsService ] [node-1] loaded module [parent-join]
[2018-05-12T15:51:44,774][INFO ][o.e.p.PluginsService ] [node-1] loaded module [percolator]
[2018-05-12T15:51:44,774][INFO ][o.e.p.PluginsService ] [node-1] loaded module [rank-eval]
[2018-05-12T15:51:44,774][INFO ][o.e.p.PluginsService ] [node-1] loaded module [reindex]
[2018-05-12T15:51:44,774][INFO ][o.e.p.PluginsService ] [node-1] loaded module [repository-url]
[2018-05-12T15:51:44,774][INFO ][o.e.p.PluginsService ] [node-1] loaded module [transport-netty4]
[2018-05-12T15:51:44,774][INFO ][o.e.p.PluginsService ] [node-1] loaded module [tribe]
[2018-05-12T15:51:44,774][INFO ][o.e.p.PluginsService ] [node-1] no plugins loaded
[2018-05-12T15:51:51,246][INFO ][o.e.d.DiscoveryModule ] [node-1] using discovery type [zen]
[2018-05-12T15:51:52,264][INFO ][o.e.n.Node ] [node-1] initialized
[2018-05-12T15:51:52,264][INFO ][o.e.n.Node ] [node-1] starting ...
[2018-05-12T15:51:53,312][INFO ][o.e.t.TransportService ] [node-1] publish_address {192.168.2.135:9300}, bound_addresses {192.168.2.135:9300}
[2018-05-12T15:51:53,360][INFO ][o.e.b.BootstrapChecks ] [node-1] bound or publishing to a non-loopback address, enforcing bootstrap checks
[2018-05-12T15:51:53,361][ERROR][o.e.b.Bootstrap ] [node-1] node validation exception
[1] bootstrap checks failed
[1]: memory locking requested for elasticsearch process but memory is not locked
[2018-05-12T15:51:53,387][INFO ][o.e.n.Node ] [node-1] stopping ...
[2018-05-12T15:51:53,426][INFO ][o.e.n.Node ] [node-1] stopped
[2018-05-12T15:51:53,426][INFO ][o.e.n.Node ] [node-1] closing ...
[2018-05-12T15:51:53,460][INFO ][o.e.n.Node ] [node-1] closed
[2018-05-12T16:17:04,738][WARN ][o.e.b.JNANatives ] Unable to lock JVM Memory: error=12, reason=Cannot allocate memory
[2018-05-12T16:17:04,760][WARN ][o.e.b.JNANatives ] This can result in part of the JVM being swapped out.
[2018-05-12T16:17:04,760][WARN ][o.e.b.JNANatives ] Increase RLIMIT_MEMLOCK, soft limit: 65536, hard limit: 65536
[2018-05-12T16:17:04,760][WARN ][o.e.b.JNANatives ] These can be adjusted by modifying /etc/security/limits.conf, for example:
# allow user 'elasticsearch' mlockall
elasticsearch soft memlock unlimited
elasticsearch hard memlock unlimited
[2018-05-12T16:17:04,760][WARN ][o.e.b.JNANatives ] If you are logged in interactively, you will have to re-login for the new limits to take effect.
[2018-05-12T16:17:06,292][INFO ][o.e.n.Node ] [node-1] initializing ...
[2018-05-12T16:17:06,637][INFO ][o.e.e.NodeEnvironment ] [node-1] using [1] data paths, mounts [[/ (rootfs)]], net usable_space [44.4gb], net total_space [46.9gb], types [rootfs]
[2018-05-12T16:17:06,637][INFO ][o.e.e.NodeEnvironment ] [node-1] heap size [1007.3mb], compressed ordinary object pointers [true]
[2018-05-12T16:17:06,639][INFO ][o.e.n.Node ] [node-1] node name [node-1], node ID [oQd6nyQKT_2FJNJpG0-vqA]
[2018-05-12T16:17:06,639][INFO ][o.e.n.Node ] [node-1] version[6.2.4], pid[18144], build[ccec39f/2018-04-12T20:37:28.497551Z], OS[Linux/3.10.0-693.el7.x86_64/amd64], JVM[Oracle Corporation/Java HotSpot(TM) 64-Bit Server VM/1.8.0_162/25.162-b12]
[2018-05-12T16:17:06,639][INFO ][o.e.n.Node ] [node-1] JVM arguments [-Xms1g, -Xmx1g, -XX:+UseConcMarkSweepGC, -XX:CMSInitiatingOccupancyFraction=75, -XX:+UseCMSInitiatingOccupancyOnly, -XX:+AlwaysPreTouch, -Xss1m, -Djava.awt.headless=true, -Dfile.encoding=UTF-8, -Djna.nosys=true, -XX:-OmitStackTraceInFastThrow, -Dio.netty.noUnsafe=true, -Dio.netty.noKeySetOptimization=true, -Dio.netty.recycler.maxCapacityPerThread=0, -Dlog4j.shutdownHookEnabled=false, -Dlog4j2.disable.jmx=true, -Djava.io.tmpdir=/tmp/elasticsearch.WLwddGqI, -XX:+HeapDumpOnOutOfMemoryError, -XX:HeapDumpPath=/var/lib/elasticsearch, -XX:+PrintGCDetails, -XX:+PrintGCDateStamps, -XX:+PrintTenuringDistribution, -XX:+PrintGCApplicationStoppedTime, -Xloggc:/var/log/elasticsearch/gc.log, -XX:+UseGCLogFileRotation, -XX:NumberOfGCLogFiles=32, -XX:GCLogFileSize=64m, -Des.path.home=/usr/share/elasticsearch, -Des.path.conf=/etc/elasticsearch]
[2018-05-12T16:17:12,677][INFO ][o.e.p.PluginsService ] [node-1] loaded module [aggs-matrix-stats]
[2018-05-12T16:17:12,677][INFO ][o.e.p.PluginsService ] [node-1] loaded module [analysis-common]
[2018-05-12T16:17:12,677][INFO ][o.e.p.PluginsService ] [node-1] loaded module [ingest-common]
[2018-05-12T16:17:12,677][INFO ][o.e.p.PluginsService ] [node-1] loaded module [lang-expression]
[2018-05-12T16:17:12,677][INFO ][o.e.p.PluginsService ] [node-1] loaded module [lang-mustache]
[2018-05-12T16:17:12,677][INFO ][o.e.p.PluginsService ] [node-1] loaded module [lang-painless]
[2018-05-12T16:17:12,677][INFO ][o.e.p.PluginsService ] [node-1] loaded module [mapper-extras]
[2018-05-12T16:17:12,677][INFO ][o.e.p.PluginsService ] [node-1] loaded module [parent-join]
[2018-05-12T16:17:12,678][INFO ][o.e.p.PluginsService ] [node-1] loaded module [percolator]
[2018-05-12T16:17:12,678][INFO ][o.e.p.PluginsService ] [node-1] loaded module [rank-eval]
[2018-05-12T16:17:12,678][INFO ][o.e.p.PluginsService ] [node-1] loaded module [reindex]
[2018-05-12T16:17:12,678][INFO ][o.e.p.PluginsService ] [node-1] loaded module [repository-url]
[2018-05-12T16:17:12,678][INFO ][o.e.p.PluginsService ] [node-1] loaded module [transport-netty4]
[2018-05-12T16:17:12,678][INFO ][o.e.p.PluginsService ] [node-1] loaded module [tribe]
[2018-05-12T16:17:12,678][INFO ][o.e.p.PluginsService ] [node-1] no plugins loaded
[2018-05-12T16:17:17,607][INFO ][o.e.d.DiscoveryModule ] [node-1] using discovery type [zen]
[2018-05-12T16:17:18,402][INFO ][o.e.n.Node ] [node-1] initialized
[2018-05-12T16:17:18,402][INFO ][o.e.n.Node ] [node-1] starting ...
[2018-05-12T16:17:18,788][INFO ][o.e.t.TransportService ] [node-1] publish_address {192.168.2.135:9300}, bound_addresses {192.168.2.135:9300}
[2018-05-12T16:17:18,796][INFO ][o.e.b.BootstrapChecks ] [node-1] bound or publishing to a non-loopback address, enforcing bootstrap checks
[2018-05-12T16:17:18,798][ERROR][o.e.b.Bootstrap ] [node-1] node validation exception
[1] bootstrap checks failed
[1]: memory locking requested for elasticsearch process but memory is not locked
[2018-05-12T16:17:18,810][INFO ][o.e.n.Node ] [node-1] stopping ...
[2018-05-12T16:17:18,830][INFO ][o.e.n.Node ] [node-1] stopped
[2018-05-12T16:17:18,830][INFO ][o.e.n.Node ] [node-1] closing ...
[2018-05-12T16:17:18,843][INFO ][o.e.n.Node ] [node-1] closed
前四排有个warning:1
2
3
4
5[root@localhost ~]# cat /var/log/elasticsearch/my-application.log
[2018-05-12T15:51:36,524][WARN ][o.e.b.JNANatives ] Unable to lock JVM Memory: error=12, reason=Cannot allocate memory
[2018-05-12T15:51:36,533][WARN ][o.e.b.JNANatives ] This can result in part of the JVM being swapped out.
[2018-05-12T15:51:36,534][WARN ][o.e.b.JNANatives ] Increase RLIMIT_MEMLOCK, soft limit: 65536, hard limit: 65536
[2018-05-12T15:51:36,534][WARN ][o.e.b.JNANatives ] These can be adjusted by modifying /etc/security/limits.conf, for example:
但不是导致退出的原因
error才是导致退出的原因1
2
3[2018-05-12T16:17:18,798][ERROR][o.e.b.Bootstrap ] [node-1] node validation exception
[1] bootstrap checks failed
[1]: memory locking requested for elasticsearch process but memory is not locked
还是内存锁定的原因,和warn一样,按照warn提示的方法解决:
在/etc/security/limits.conf文件后面添加
vim /etc/security/limits.conf1
2
3# allow user 'elasticsearch' mlockall
elasticsearch soft memlock unlimited
elasticsearch hard memlock unlimited
或者允许所有用户1
2
3# allow all user mlockall
* soft memlock unlimited
* hard memlock unlimited
保存后重新登录,或者sysctl -p使配置生效
启动ElasticSearch1
service elasticsearch
跟踪日志1
tail -f /var/log/elasticsearch/my-application.log
还是失败
猜想可能内存还是不够
关机,增大内存到2G
启动还是不行
查看官方文档
https://www.elastic.co/guide/en/elasticsearch/reference/current/_memory_lock_check.html#_memory_lock_check
原来我在设置中打开了memory lock check,编辑配置文件,并注释掉
vim /etc/elasticsearch/elasticsearch.yml
注释掉1
2
3# Lock the memory on startup:
#
#bootstrap.memory_lock: true
再次启动
跟踪日志没有报错了1
2
3
4
5
6
7
8
9
10
11
12
13
14[root@localhost opt]# curl http://localhost:9200
{
"name" : "node-1",
"cluster_name" : "my-application",
"cluster_uuid" : "jIK1S2b9Qcm7xf0FcqkxUA",
"version" : {
"number" : "5.6.9",
"build_hash" : "877a590",
"build_date" : "2018-04-12T16:25:14.838Z",
"build_snapshot" : false,
"lucene_version" : "6.6.1"
},
"tagline" : "You Know, for Search"
}
=======
这俩组件设置好后,你可以把naxsi的日志用NxTool插入到ElasticSearch中。以下是一个在生产环境中的样例:
配置 - NXTOOL
cd /opt/naxsi-0.55.3/nxapi
cat nxapi.json1
2
3
4
5
6
7
8"elastic" : {
"host" : "127.0.0.1:9200",
"index" : "nxapi",
"doctype" : "events",
"default_ttl" : "7200",
"max_size" : "1000",
"version" : "5"
},
这个配置貌似是解析的很严格,冒号(:)两边必须要空一格
运行1
./nxtool.py -c nxapi.json -x
========
如果是使用ES6,这里就会报错,别问我为什么知道(哭QwQ1
2
3
4
5./nxtool.py -c nxapi.json -x
# size :1000
# Whitelist(ing) ratio :
Unknown / Unspecified ES version in nxapi.json : 6
搜索issue
https://github.com/nbs-system/naxsi/pull/330#discussion_r91724633
https://github.com/nbs-system/naxsi/issues/408
issue称:现在只支持 Elasticsearch 1 / 2 / 5
开发者回答说:他们现在没用ES 6,但是我们欢迎你提交PR。。。
=============
配置nxapi
参考https://github.com/nbs-system/naxsi/tree/master/nxapi
设置ElasticSearch
进入nxapi目录,安装nxapi依赖
1
2
3cd /opt/naxsi-0.55.3/nxapi/
python setup.py install
pip install elasticsearch验证ElasticSearch是否正确运行:
1
curl -XGET http://localhost:9200/
添加nxapi索引到ElasticSearch:
1
curl -XPUT 'http://localhost:9200/nxapi/'
将日志内容加载到ElasticSearch
- 开启学习模式(learning mode)
- 自行浏览你的nginx网站,以生成日志
进入到
nxapi的目录1
cd /opt/naxsi-0.55.3/nxapi/
将日志文件加载到ElasticSearch:
日志文件是指naxsi生成的日志文件。1
./nxtool.py -c nxapi.json --files=/var/log/nginx/naxsi.log
查看数据是否正确添加:
1
curl -XPOST "http://localhost:9200/nxapi/events/_search?pretty" -d '{}'
查看nxtool是否正确看到数据:
1
./nxtool.py -c nxapi.json -x
输出:1
2
3
4
5
6
7
8
9
10
11
12
13
14
15
16
17
18root@debian:/opt/naxsi-0.55.3/nxapi# ./nxtool.py -c nxapi.json -x
# size :1000
# Whitelist(ing) ratio :
# Top servers :
# xxxx.xxxx.xxxx 71.43% (total:5/7)
# xxx.xxx.xxx.xxx 28.57% (total:2/7)
# Top URI(s) :
# / 71.43% (total:5/7)
# /GponForm/diag_Form 14.29% (total:1/7)
# /wls-wsat/CoordinatorPortType 14.29% (total:1/7)
# Top Zone(s) :
# ARGS 42.86% (total:3/7)
# BODY 28.57% (total:2/7)
# HEADERS 28.57% (total:2/7)
# Top Peer(s) :
# xxx.xxx.xxx.xx 71.43% (total:5/7)
# 111.230.175.116 14.29% (total:1/7)
# 95.222.27.133 14.29% (total:1/7)
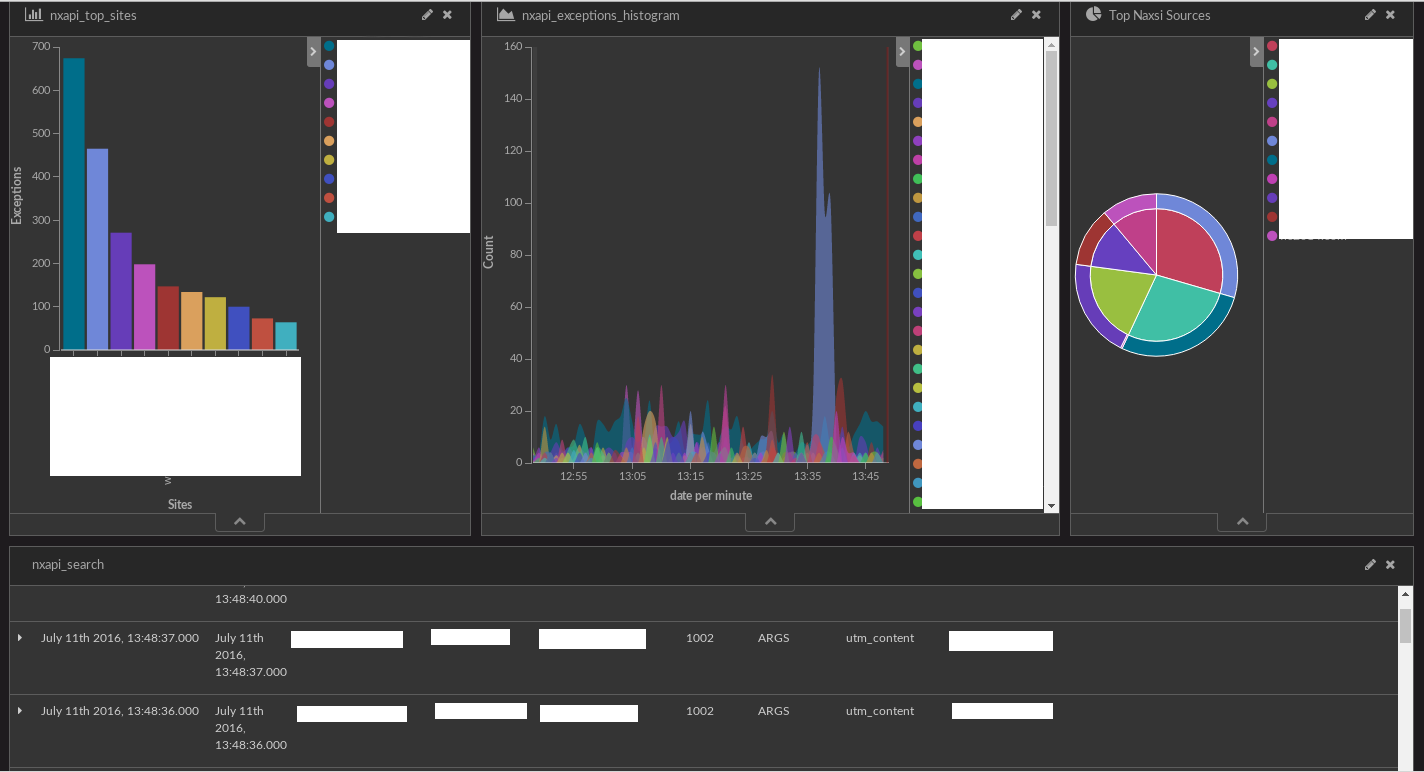
配置kibana的可视化数据
https://www.elastic.co/guide/en/kibana/current/dashboard.html
wiki中给的链接默认跳转到最新的kibana教程
https://www.elastic.co/guide/en/kibana/index.html
这个是kibana的历史版本的教程
我们选择5.6的版本
https://www.elastic.co/guide/en/kibana/5.6/index.html
建立仪表盘:
https://www.elastic.co/guide/en/kibana/5.6/dashboard.html
kibana配置认证
kibana从5.5开始不提供认证功能,使用nginx做反向代理,使用basic auth认证kibana:
https://www.cnblogs.com/configure/p/7607302.html
- 安装htpasswd
对于Debian
先搜索htpasswd在哪个包里1
2
3
4
5
6
7
8
9
10
11
12
13
14root@debian:~# apt search htpasswd
Sorting... Done
Full Text Search... Done
apache2-utils/oldstable 2.4.10-10+deb8u12 amd64
Apache HTTP Server (utility programs for web servers)
golang-github-abbot-go-http-auth-dev/jessie-backports 0.0~git20150714.0.46b9627-1~bpo8+1 all
Basic and Digest HTTP Authentication for golang http
libapache-htpasswd-perl/oldstable 1.8-1.1 all
Manage Unix crypt-style password file
lighttpd/oldstable,oldstable 1.4.35-4+deb8u1 amd64
fast webserver with minimal memory footprint
第一个就是了,,1
apt install -y apache2-utils
- 生成密码文件
1
2# mkdir -p /etc/nginx/passwd
# htpasswd -c -b /etc/nginx/passwd/kibana.passwd user pass
参数解释
-c Create a new file.
-b Use the password from the command line rather than prompting for it.
第一次生成密码,加上-c选项自动创建,第二次就不能加了,否则会覆盖上次的文件。-b选项会把你输入的user和加密的pass一起放到密码文件的最后一排。
- 配置nginx对kibana的反向代理和http basic auth
本来是准备用location /kibanaproxy到http://127.0.0.1:5601,后来考虑到80端口就放有漏洞的网站测试好点.
如果要这样反向代理的话,还要修改kibana.yml中的server.basePath值1
2
3
4# Enables you to specify a path to mount Kibana at if you are running behind a proxy. This only affects
# the URLs generated by Kibana, your proxy is expected to remove the basePath value before forwarding requests
# to Kibana. This setting cannot end in a slash.
server.basePath: ""
vim /etc/nginx/nginx.conf1
2
3
4
5
6
7
8
9
10
11server {
listen 5601;
auth_basic "Kibana Auth";
auth_basic_user_file /etc/nginx/passwd/kibana.passwd;
location / {
proxy_pass http://127.0.0.1:5601;
proxy_redirect off;
}
}
- 修改kibana配置
vim /etc/kibana/kibana.yml1
server.host: "0.0.0.0"
改为1
server.host: "localhost"
127.0.0.1或者localhost都可以
- 重启kibana和nginx
先kibana1
# service kibana restart
nginx
因为是编译的nginx,所有没有加入service服务的1
2
3root@debian:~# service nginx restart
Failed to restart nginx.service: Unit nginx.service failed to load: No such file or directory.
root@debian:~# nginx -s reload
- 访问
http://<your ip/host>:56011
2
3
4
5
6
7
8└─[$] <> curl http://xxx.xxx.xxxx:5601
<html>
<head><title>401 Authorization Required</title></head>
<body bgcolor="white">
<center><h1>401 Authorization Required</h1></center>
<hr><center>nginx/1.14.0</center>
</body>
</html>
似乎是好了,但是浏览器认证通过后,返回500,而且是页脚是nginx,肯定是nginx配置有问题
查看log1
2
3
42018/05/16 23:55:09 [alert] 21318#0: *1024 1024 worker_connections are not enough while connecting to upstream, client: 127.0.0.1, server: xx.xx.xx, request: "GET / HTTP/1.0", upstream: "http://127.0.0.1:5601/", host: "127.0.0.1:5601"
2018/05/16 23:56:37 [alert] 21318#0: *2047 1024 worker_connections are not enough while connecting to upstream, client: 127.0.0.1, server: xx.xx.xx, request: "GET / HTTP/1.0", upstream: "http://127.0.0.1:5601/", host: "127.0.0.1:5601"
2018/05/16 23:59:03 [notice] 21931#0: signal process started
2018/05/16 23:59:09 [alert] 21932#0: *5580 1024 worker_connections are not enough while connecting to upstream, client: 127.0.0.1, server: xx.xx.xx, request: "GET / HTTP/1.0", upstream: "http://127.0.0.1:5601/", host: "127.0.0.1:5601"
curl http://127.0.0.1:56011
2
3
4
5
6
7
8root@debian:~# curl http://127.0.0.1:5601
<html>
<head><title>401 Authorization Required</title></head>
<body bgcolor="white">
<center><h1>401 Authorization Required</h1></center>
<hr><center>nginx/1.14.0</center>
</body>
</html>
死循环了喵~~
这个nginx和kibana的监听好像是不能区分localhost和外网的端口的。。
把nginx的监听改5600好了。。1
2
3
4
5
6
7
8
9
10
11server {
listen 5600;
server_name xx.xx.xx;
auth_basic "Kibana Auth";
auth_basic_user_file /etc/nginx/passwd/kibana.passwd;
location / {
proxy_pass http://127.0.0.1:5601;
proxy_redirect off;
}
}
访问 http://<your ip/host>:5600 认证即可